Segmentation violation problem while plotting a graph
Hello,
When I try to plot a graph using C code with root I got this issue:
root [0] .x plotBR.C
*** Break *** segmentation violation
There was a crash.
This is the entire stack trace of all threads:
#0 0x00007f55b64d03ea in __GI___wait4 (pid=4247, stat_loc=stat_loc
entry=0x7ffc0839b158, options=options
entry=0, usage=usage
entry=0x0) at ../sysdeps/unix/sysv/linux/wait4.c:30
#1 0x00007f55b64d03ab in __GI___waitpid (pid=, stat_loc=stat_loc
entry=0x7ffc0839b158, options=options
entry=0) at ./posix/waitpid.c:38
#2 0x00007f55b6436bdb in do_system (line=) at ../sysdeps/posix/system.c:171
#3 0x00007f55b6b858a4 in TUnixSystem::StackTrace() () from /home/feyza/root/lib/libCore.so.6.26
#4 0x00007f55b6b82bb5 in TUnixSystem::DispatchSignals(ESignals) () from /home/feyza/root/lib/libCore.so.6.26
#5
#6 __memmove_sse2_unaligned_erms () at ../sysdeps/x86_64/multiarch/memmove-vec-unaligned-erms.S:592
#7 0x00007f559bcff0b9 in TGraph::ExpandAndCopy(int, int) () from /home/feyza/root/lib/libHist.so.6.26.10
#8 0x00007f559bcff4a9 in TGraph::SetPoint(int, double, double) () from /home/feyza/root/lib/libHist.so.6.26.10
#9 0x00007f55b685b4a5 in ?? ()
#10 0x00007f55b1d97c28 in ?? () from /home/feyza/root/lib/libCling.so
#11 0x00007f55b2443920 in ?? () from /home/feyza/root/lib/libCling.so
#12 0x0000000000000016 in ?? ()
#13 0x000055ce365c21d0 in ?? ()
#14 0x000055ce39dee0c0 in ?? ()
#15 0x1655e5a81acdae00 in ?? ()
#16 0x00007f55b546eb5b in ?? () from /home/feyza/root/lib/libCling.so
#17 0x00007f55b6751310 in ?? () from /lib/x86_64-linux-gnu/libstdc++.so.6
#18 0x000055ce39e01120 in ?? ()
#19 0x000055ce39dfbc70 in ?? ()
#20 0x000055ce365b13d0 in ?? ()
#21 0x0000000000000000 in ?? ()
The lines below might hint at the cause of the crash.
You may get help by asking at the ROOT forum https://root.cern/forum
Only if you are really convinced it is a bug in ROOT then please submit a
report at https://root.cern/bugs Please post the ENTIRE stack trace
from above as an attachment in addition to anything else
that might help us fixing this issue.
#6 __memmove_sse2_unaligned_erms () at ../sysdeps/x86_64/multiarch/memmove-vec-unaligned-erms.S:592
#7 0x00007f559bcff0b9 in TGraph::ExpandAndCopy(int, int) () from /home/feyza/root/lib/libHist.so.6.26.10
#8 0x00007f559bcff4a9 in TGraph::SetPoint(int, double, double) () from /home/feyza/root/lib/libHist.so.6.26.10
#9 0x00007f55b685b4a5 in ?? ()
#10 0x00007f55b1d97c28 in ?? () from /home/feyza/root/lib/libCling.so
#11 0x00007f55b2443920 in ?? () from /home/feyza/root/lib/libCling.so
#12 0x0000000000000016 in ?? ()
#13 0x000055ce365c21d0 in ?? ()
#14 0x000055ce39dee0c0 in ?? ()
#15 0x1655e5a81acdae00 in ?? ()
#16 0x00007f55b546eb5b in ?? () from /home/feyza/root/lib/libCling.so
#17 0x00007f55b6751310 in ?? () from /lib/x86_64-linux-gnu/libstdc++.so.6
#18 0x000055ce39e01120 in ?? ()
#19 0x000055ce39dfbc70 in ?? ()
#20 0x000055ce365b13d0 in ?? ()
#21 0x0000000000000000 in ?? ()
The same plotting code used to work before, I do not understand why this happens now, can you help, please? I read some previous issues, here are some information asked for before:
feyza@hp8470p:~/Madgraph/mg_outputs/Vle_decay_widths$ df -h
Filesystem Size Used Avail Use% Mounted on
tmpfs 781M 1,8M 779M 1% /run
/dev/sda2 164G 134G 22G 87% /
tmpfs 3,9G 0 3,9G 0% /dev/shm
tmpfs 5,0M 4,0K 5,0M 1% /run/lock
/dev/sda1 511M 6,1M 505M 2% /boot/efi
tmpfs 781M 72K 781M 1% /run/user/1000
Here is the plotting C code I am using:
Blockquote
void plotBR()
{
TGraph *gr = new TGraph();
TGraph *gr1 = new TGraph();
TGraph *gr2 = new TGraph();gr->SetLineWidth(2); gr->SetLineColor(kRed);gr1->SetLineWidth(2);
gr1->SetLineColor(kBlue);gr2->SetLineWidth(2);
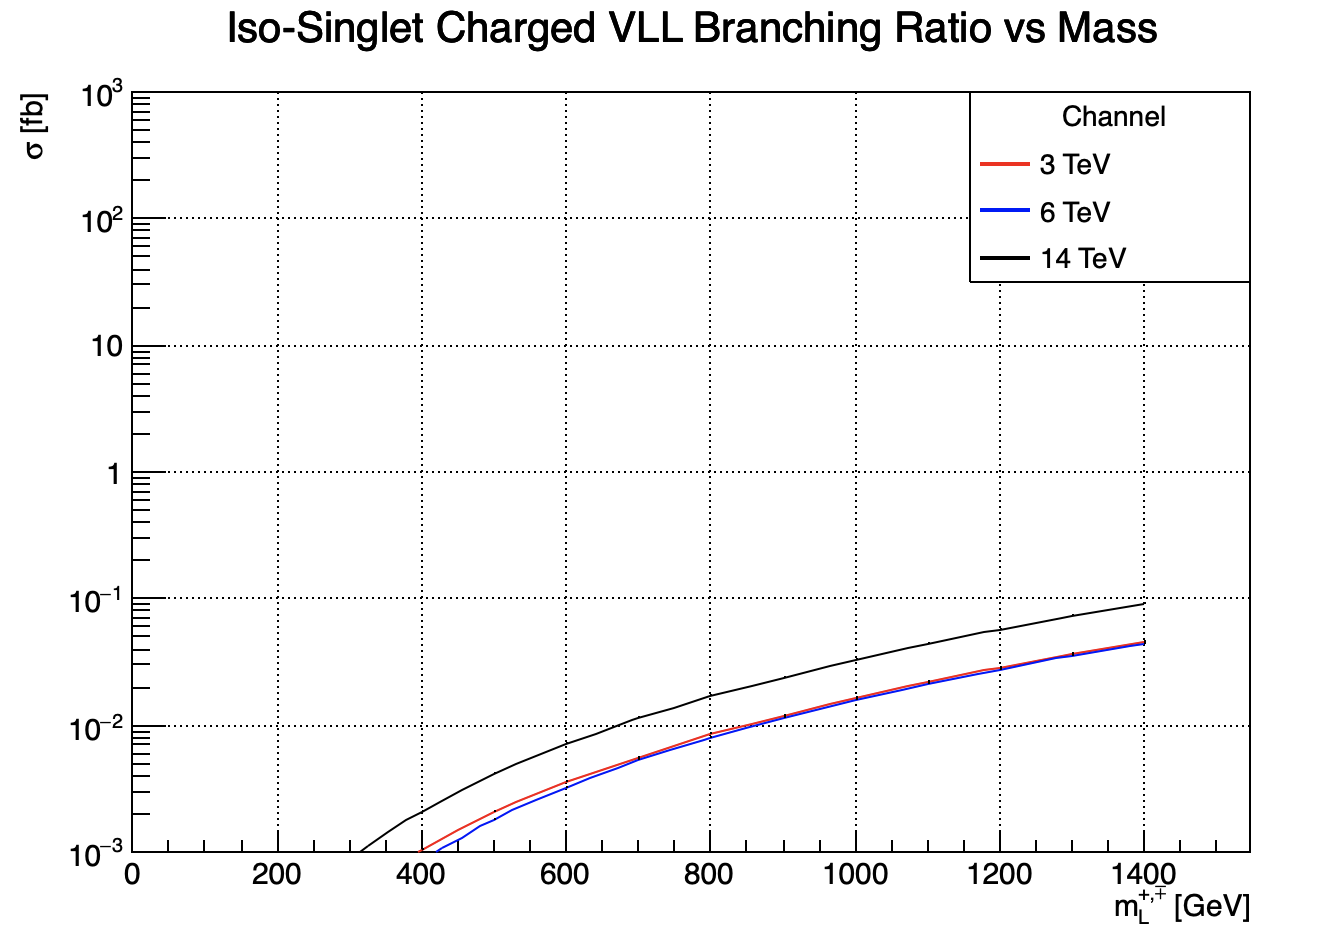
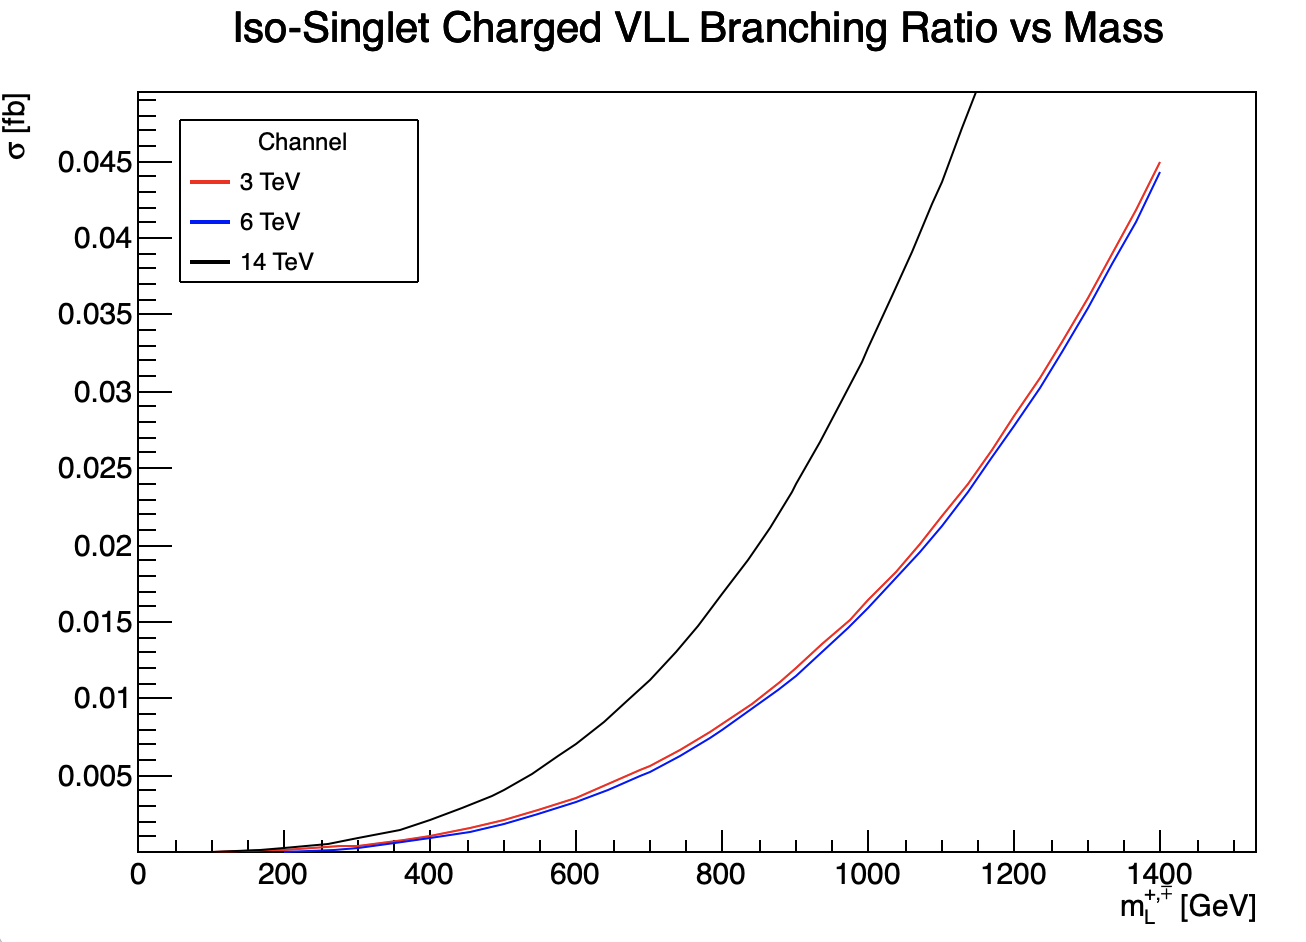
gr2->SetLineColor(kBlack);gr->SetTitle("Iso-Singlet Charged VLL Branching Ratio vs Mass"); gr->GetXaxis()->SetTitle("m_{L}^{+,#mp} [GeV]"); gr->GetYaxis()->SetTitle("#sigma [fb]"); fstream file; file.open("vle_Z_BR", ios::in); while(1) { double x, y; file >> x >> y; gr->SetPoint(gr->GetN(),x, y*1000); //cout << gr->GetN()<<endl; if(file.eof()) break; } file.close(); file.open("vle_H_BR",ios::in); while(1) { double x2,y2; file >> x2 >> y2; gr1->SetPoint(gr1->GetN(),x2,y2); if(file.eof()) break; } file.close(); file.open("vle_W_BR",ios::in); while(1) { double x3,y3; file >> x3 >> y3; gr2->SetPoint(gr2->GetN(),x3,y3); if(file.eof()) break; } file.close(); gr->SetMarkerSize(1);gr1->SetMarkerSize(1);
gr2->SetMarkerSize(1);TCanvas *c1 = new TCanvas();c1->SetLogy();
c1->SetGridx(1);
c1->SetGridy(1);gr->Draw(“ACP”);
gr1->Draw(“CP same”);
gr2->Draw(“CP same”);gr->GetXaxis()->SetRangeUser(0,10000);
gr->GetYaxis()->SetRangeUser(1e-03,1e+03);TLegend *legend = new TLegend(0.7,0.7,0.9,0.9);
legend → SetHeader(“Channel”,“C”);
legend → AddEntry(gr,“3 TeV”,“l”);
legend → AddEntry(gr1,“6 TeV”,“l”);
legend → AddEntry(gr2,“14 TeV”,“l”);
legend → Draw();}
System: Linux hp8470p 5.15.0-78-generic #85-Ubuntu x86_64 GNU/Linux
ROOT VERSION: 6.26/10
Please let me know if more information is needed. Thank you in advance.