Dear expert,
Recently I’m working on 2D plots with option ‘COLZText’, filling bins with color and value. My code reads the background color to choose text color, to keep enough contrast. But seems the ‘GetValueColor’ from PaletteAxis doesn’t return the correct color. I also tried GetBinColor which return the same results as GetValueColor.
Here I attached my test code:
import os
from ROOT import TH2F, TCanvas, gStyle, gROOT


def plot_grid(log_z=1):
    my_canvas = TCanvas('my_canvas', 'my_canvas', 800, 600)
    my_canvas.SetMargin(0.05, 0.10, 0.05, 0.05)
    my_canvas.SetLogz(log_z)
    histo_grid = TH2F('h2', 'h2', 5, 0, 5, 5, 0, 5)
    for ix in range(1, 6):
        for iy in range(1, 6):
            histo_grid.SetBinContent(ix, iy, ix+iy)

    histo_grid.Draw('COLZText')
    h_new = keep_text_contrast(histo_grid)

    my_canvas.Print('palette_test.pdf')


def set_style():
    gROOT.SetBatch()
    gStyle.SetPalette(68)

    gStyle.SetOptStat(0)
    gStyle.SetOptTitle(0)
    gStyle.SetOptFit(0)
    gStyle.SetLegendBorderSize(0) # no legend borders

    #put tick marks on top and RHS of plots
    gStyle.SetPadTickX(1)
    gStyle.SetPadTickY(1)


if __name__ == '__main__':
    set_style()
    plot_grid(1)
and the keep_text_contrast is like,
def keep_text_contrast(histo):
    """Draw a dummy histogram to change text color"""
    gPad.Update()
    palette = histo.GetListOfFunctions().FindObject("palette")
    h_new = histo.Clone("forText")
    for ix in range(1, h_new.GetNbinsX()+1):
        for iy in range(1, h_new.GetNbinsY()+1):
            print 'bin:', ix, iy, 'content:', ix+iy
            color = gROOT.GetColor(palette.GetBinColor(ix, iy))
            #color = gROOT.GetColor(get_bin_color(histo, ix, iy))
            convert = is_dark_color(color)
            if not convert:
                h_new.SetBinContent(ix, iy, 0)
            else:
                content = histo.GetBinContent(ix, iy)
                h_new.SetBinContent(ix, iy, content)
    h_new.SetMarkerColor(0)
    h_new.Draw("TEXT,SAME")
    return h_new


def get_rgb(t_color):
    r, g, b = array('f', [0]), array('f', [0]), array('f', [0])
    t_color.GetRGB(r, g, b)
    return r[0]*255, g[0]*255, b[0]*255


def is_dark_color(t_color):
    r, g, b = get_rgb(t_color)
    brightness = r*0.299 + g*0.587 + b*0.114
    print 'RGB:', int(r), int(g), int(b)
    return brightness < 60
When printing out the RGB value of each bin, I find that it is not what I got in the plot. Then I implemented my own code to get value color, following TPaletteAxis::GetValueColor, and it works. I’m not sure if I doing something incorrectly?
"""My get value/bin color follows the root code"""

def get_value_color(histo, value):
    v_min = histo.GetMinimum()
    v_max = histo.GetMaximum()
    if gPad.GetLogz():
        if v_min <= 0 and v_max > 0:  # avoid value error
            v_min = min(1, v_max * 0.001)
        v_min = math.log10(v_min)
        v_max = math.log10(v_max)
    n_colors = gStyle.GetNumberOfColors()  # n colors in whole palette
    n_div_z = histo.GetContour()  # contour levels in z-axis
    if not n_div_z:
        return 0
    scale = n_div_z / (v_max - v_min)
    if gPad.GetLogz():
        if value <= 0:
            return 0
        value = math.log10(value)
    if value < v_min:
        value = v_min
    # contour index
    i_level = int(0.01 + n_div_z * (value-v_min)/(v_max-v_min))
    # color index in palette
    i_color = int(n_colors/n_div_z * (i_level+0.99))
    #print i_level, i_color
    return gStyle.GetColorPalette(i_color)


def get_bin_color(histo, ix, iy):
    value = histo.GetBinContent(ix, iy)
    return get_value_color(histo, value)
Result using palette GetBinColor()
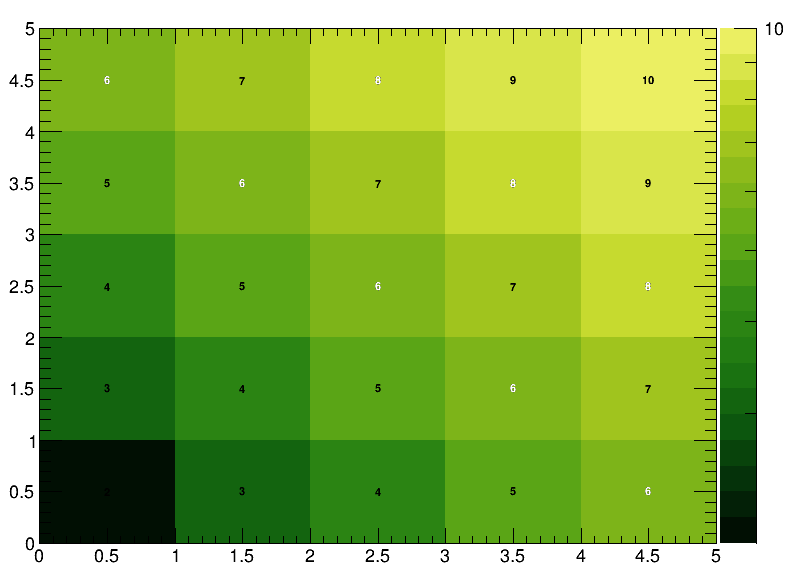
Result using my own get_bin_color()