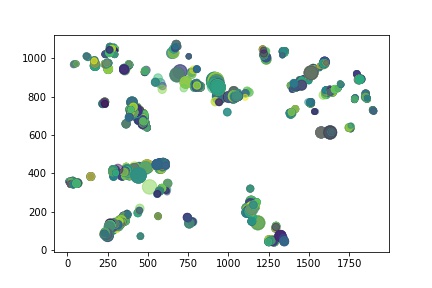
I am trying to produce 2D scatter plot with 3 variable set x-coordinate, y-coordinate and radius of the event or circle. I am not sure how to add radius to the Scatter plot. Is there any way possible to plot these data?
I am trying to produce similar plot as below, I produced using python,
I don’t think there’s an option to automatically have markers proportional to the “value” (except with “boxes”, see below); you could set by hand a marker size (proportional to the radius) for every point, but for this you need one TGraph for each point (or at least for each radius size), so it’s not practical when you have many points.
With ROOT you can have boxes bt drawing a 2D histogram with the “box” option; you make a TH2D histogram and fill it with SetBinContent, e.g. h->SetBinContent(binx,biny,radius) and when drawn, the boxes are proportional to the radius; however, in your plot it seems that many circles are overlapping, and this will not look like that in ROOT, as each box will be constrained to its bin size.
This visualization as a scatter plot isn’t working well for HEP: how do you determine the circles’ center, how many neighboring points are combined, and how many circles are occluded?
I would assume that this is actually a graph, with precise X and Y positions, and a value (Z) at that point. This can be done with a TGraph2D.
If you are indeed plotting a 2D histogram (“scatter plot” seems to suggest that) then the BOX option sounds like a superior visualization.
Actually, the option BOX will work for binned data (TH2). I am not sure your data are binned. At least it is not obvious from the plot you posted.
I made a prototype of real scatter plots (not yet in the ROOT code) which might be more useful in your case. The macro code looks like this:
/// \file
/// \ingroup tutorial_graphs
/// \notebook
/// Draw a scatter plot.
///
/// \macro_image
/// \macro_code
///
/// \author Olivier Couet

void scatter()
{
   auto canvas = new TCanvas();
   gStyle->SetPalette(kRainBow, 0, 0.5); // define a transparent palette


   const int n = 100;
   double x[n];
   double y[n];
   double c[n];
   double s[n];

   // Define four random data set
   auto r  = new TRandom();
   for (int i=0; i<n; i++) {
      x[i] = 100*r->Rndm(i);
      y[i] = 200*r->Rndm(i);
      c[i] = 300*r->Rndm(i);
      s[i] = 400*r->Rndm(i);
   }

   auto scat = new TScatter(n, x, y,c,s);
   scat->SetMarkerStyle(20);
   scat->SetMarkerColor(kRed);
   scat->SetTitle("Scatter plot;X;Y");
   scat->Draw("A");
}