ROOT Version: 6.32.04
Platform: WSL2 Ubuntu
Hello! Is it possible to make a scatter plot of two float vectors? Thanks in advance. Cheers.
ROOT Version: 6.32.04
Platform: WSL2 Ubuntu
Hello! Is it possible to make a scatter plot of two float vectors? Thanks in advance. Cheers.
You can put them in a TGraph (see the constructor with 2 float vectors) and then draw the graph (see the draw options). Probably you’ll want to Sort the graph before drawing it to avoid issues.
An alternative, a bit more elaborate, could be to put the data (either as vectors, or each pair of points as an entry) in a tree (e.g. as branches “x” and “y”) and then draw the tree as scatter plot (e.g. tree->Draw("y:x").
Thanks for the response. This is a gist of my current code.
// define vectors
TVectorF vec1(size), vec2(size);

// loop fill vectors
for(i) {
    vec1[i] = data;
    vec1[i] = data;
}

// define scatter graph
TGraph *graph= new TGraph(vec1, vec2);
However, this gives a null output when I try to draw this graph. Am I missing something?
And for your second solution (which would be easier for me since the data exists in a tree branch already), I tried this code:
#include "TFile.h"
#include "TTree.h"
#include "TGraph.h"

// Code
void plot()
{
	TFile *input = new TFile("cut_FCC365.root", "READ");
	TTree *trees = (TTree*)input ->Get("tree_cut");

	TCanvas *canvas = new TCanvas("myCanvas", "Scatter Plot", 800, 600);
	trees->Draw("vec1:vec2");
}
However, this gives an empty canvas. I can also confirm the vectors are not empty from TBrowser. Any thoughts?
Try the 4th constructor (“4/12”) on the page I linked above:
{
  vector<float> v1, v2;

  for (int i=0; i<3; ++i) {
    v1.push_back(i);
    v2.push_back(2*i);
  }
  TGraph *gr= new TGraph(3, &v1[0], &v2[0]);
  gr->Draw("a*");
}
Hi. It still gives this error:
warning: null passed to a callee that requires a non-null argument [-Wnonnull]
For more context, I have two separate scripts. The first conditions data and writes histograms and graphs into a ROOT file:
void script1() {

  TFile *output = new TFile("output.root", "RECREATE");
  TTree *tree= new TTree("tree", "tree");

  vector<float> v1, v2;

  for () {
    v1.push_back(data);
    v2.push_back(data);
  }

  TGraph *graph = new TGraph(3, &v1[0], &v2[0]);
  tree->Branch("graph", &graph, "graph");

  output->Write();
  output->Close();

}
The second reads this ROOT file and draws the plots:
void script2() {

  TFile *input = new TFile("output.root", "READ");
  TTree *tree= (TTree*)input ->Get("tree");

  TGraph *graph= (TGraph*)input ->Get("graph");
  graph->Draw("a*");

}
Sorry for the complexity. I am unable to merge it into the same code since the first runs Pythia/FastJet and I get an error when running the first script with the root script1.cc command.
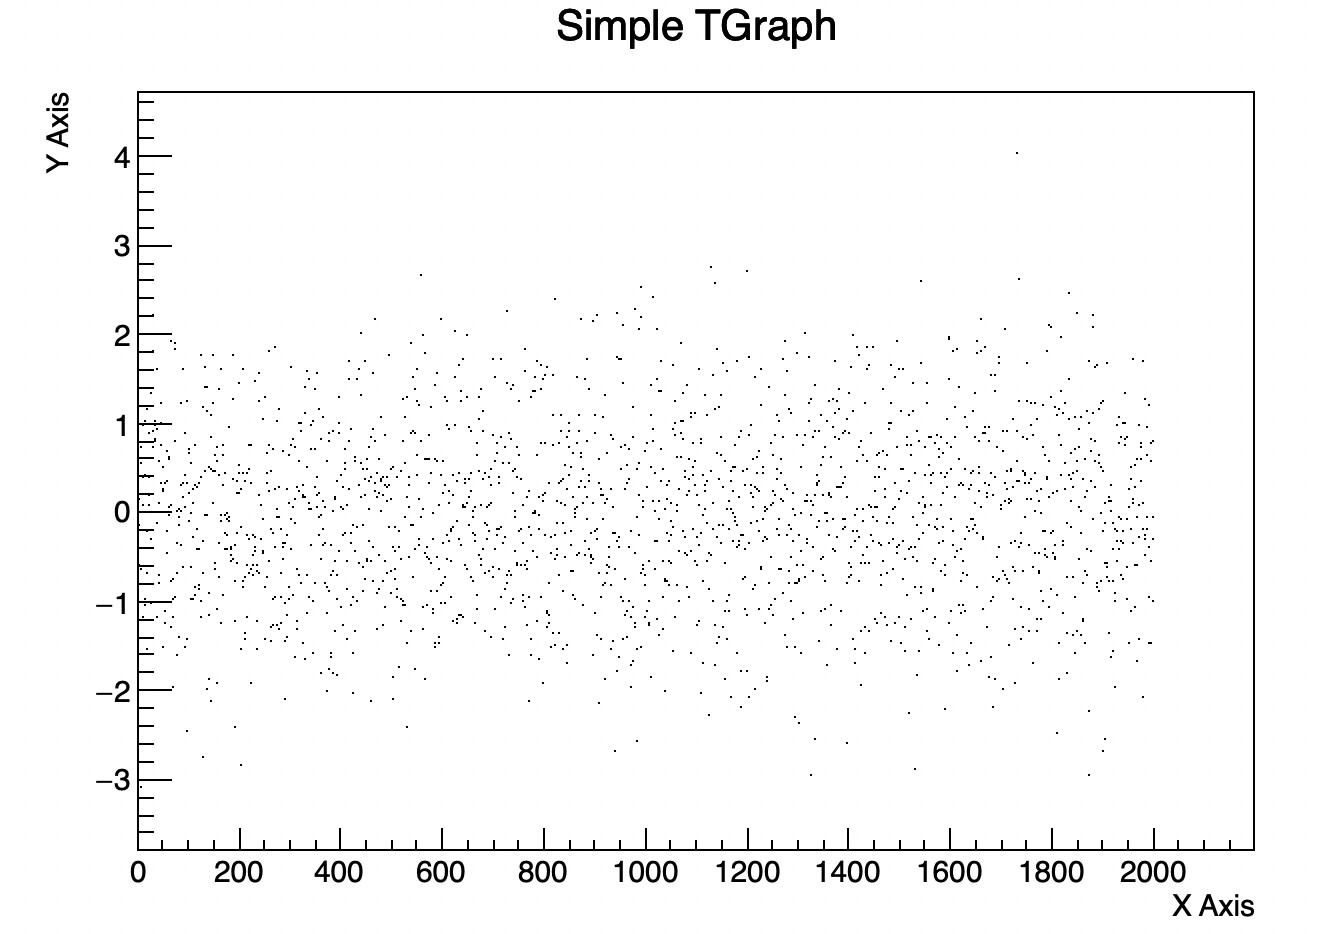
void simpleTGraph() {
    const int n = 2000;
    double x[n], y[n];

    TRandom rand;
    for (int i = 0; i < n; ++i) {
        x[i] = i;
        y[i] = rand.Gaus(0, 1);
    }

    TGraph *graph = new TGraph(n, x, y);
    graph->SetTitle("Simple TGraph");
    graph->GetXaxis()->SetTitle("X Axis");
    graph->GetYaxis()->SetTitle("Y Axis");
    graph->SetMarkerStyle(1);

    graph->Draw("AP");
}
@couet Thanks for the code. Is it possible to do the same with float vectors?
Yes, just replace:
double x[n], y[n];
by
float x[n], y[n];
Thanks!