Scatter plot and TTree::Draw

Dear ROOT experts,

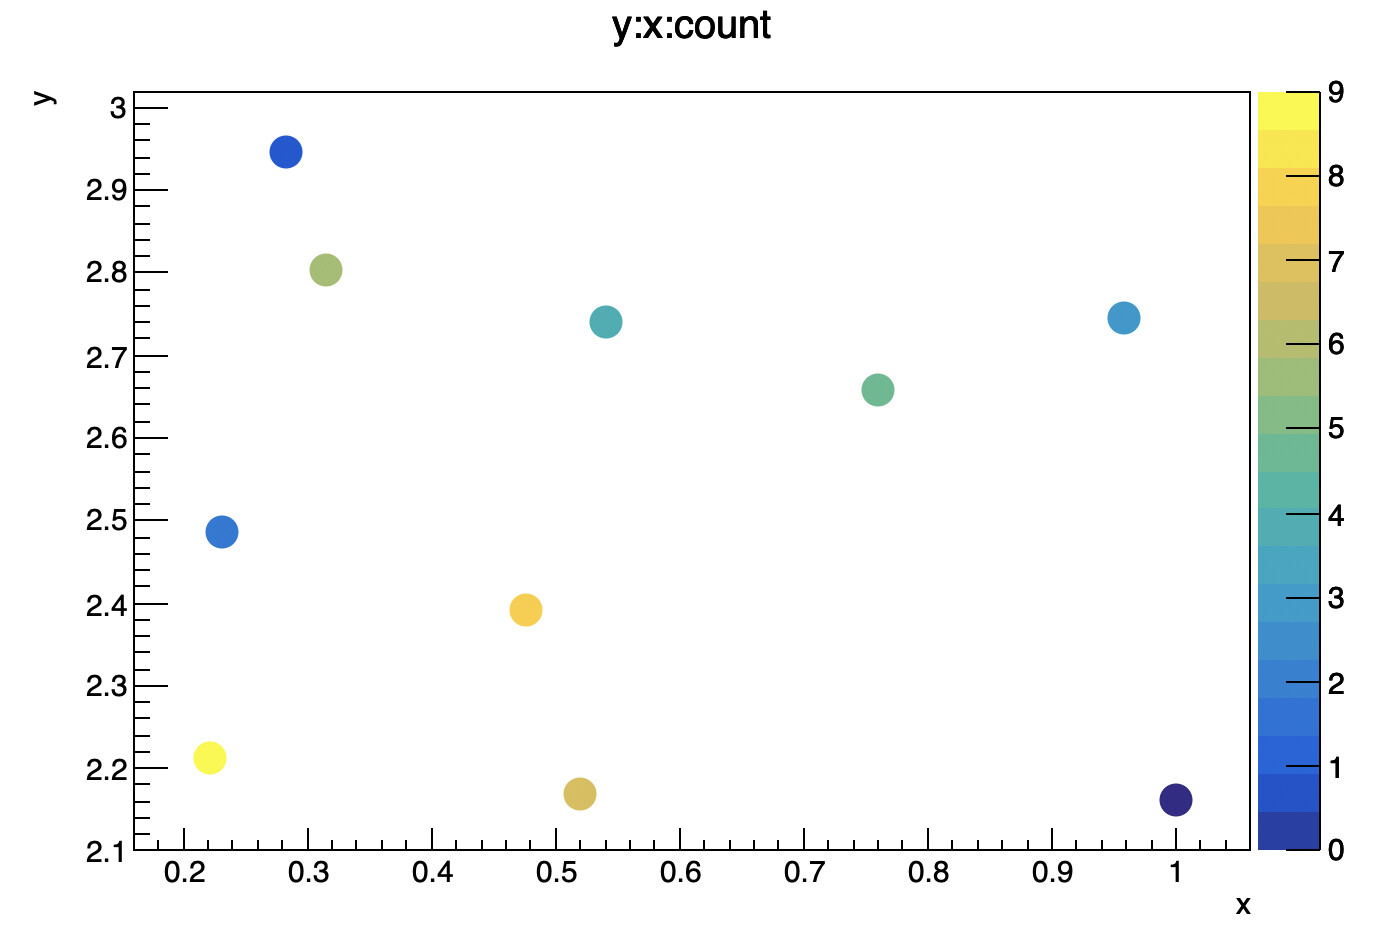
I would like to draw a scatter plot. Unfortunately, I do not have access to root v6.30 and TScatter. Following the discussions on blog, I would like to try TTree::Draw with option "COLZ".

After reading document, I got confused. It is said given e1:e2:e3, a TPolyMarker3D is drawn. However, it is said a TH3F object can be retrieved with three variables. I try to understand things from the source code in TTreePlayer::DrawSelect. I do not see the explicit creation of TPolyMarker3D.

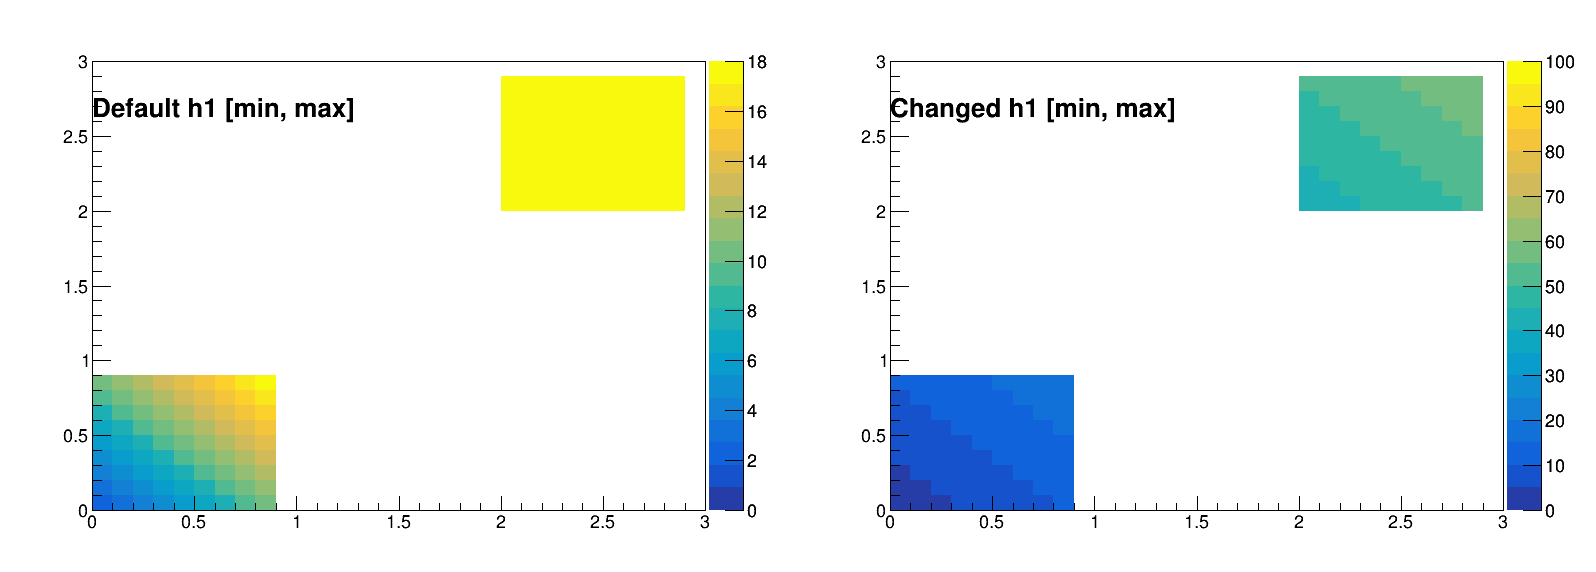
I also tried to manipulate a toy example. It shows me the histogram is filled and the maximum and minimum are those of z components.

I do not want to bin data points to TH3F which is subject to bin width and reduce granularity. I would like to have a series of discrete points like TGraph2D but in flat view. I have no idea of use by TH3F here.

I have several questions in mind.

  • What is the use for TH3F here? Is it only for frame drawing? Is it also for data storage? Will the data points be binned to a histogram?
  • What can I do to set marker properties? I tried hist->SetMarkerSize but it seems not working.
  • What is the use of TH1::GetListOfFunctions. I found a TObjArray called graphs after printing it out. What are object and class saved in this array? I tried to call TObject::Print by dereferencing each object and it returns me a (x, y) pair.
  • If I would like to create a TPolyMarker3D, how can I draw it in a flat view like TH2::Draw("COLZ")?

A test macro is also attached here.

#include <iostream>

#include "TNtuple.h"
#include "TCanvas.h"
#include "TH2F.h"
#include "TH3F.h"

void test ()
{
    TNtuple t("t", "", "x:y:z");
    float a[3];
    for (int i=0; i<100; ++i) {
        a[0] = i;
        a[1] = 2*i+1;
        a[2] = i+2;
        t.Fill(a);
    }
    TCanvas* c = new TCanvas;
    t.Draw("x:y:z", "", "COLZ");
    auto htemp = (TH3F*)c->FindObject("htemp");
    std::cout << htemp->GetXaxis()->GetNbins() << std::endl;;
    std::cout << htemp->GetYaxis()->GetNbins() << std::endl;;
    std::cout << htemp->GetZaxis()->GetNbins() << std::endl;;
    std::cout << htemp->GetEntries() << std::endl;;
    //htemp->Print("all");
    gPad->Modified();
    gPad->Update();
    std::cout << "Maximum " << htemp->GetMaximum() << "\n";
    std::cout << "Minimum " << htemp->GetMinimum() << "\n";
    htemp->GetListOfFunctions()->Print("");
//    auto objs = (TObjArray*)htemp->GetListOfFunctions()->FindObject("graphs");
//    for (int i=0; i<objs->GetSize(); ++i) {
//        auto ptr = objs->At(i);
//        if (ptr) {
//            ptr->Print();
//            std::cout << ptr->GetName() << "\n";
//        }
//    }
//
}

Many thanks in advance!


Please read tips for efficient and successful posting and posting code

ROOT Version: 6.28
Platform: Debian x86_64
Compiler: gcc 12


And if I plot multiple times, how can I draw these plots under same color bar?

Hi,

Is this perhaps what you also asked here? If yes, there is no problem at all for this time, but could you try not to duplicate questions?

Thanks a lot for your understanding!

Cheers,
D

  • What is the use for TH3F here? Is it only for frame drawing? Is it also for data storage? Will the data points be binned to a histogram?

yes only for drawing. the data are not binned

  • What can I do to set marker properties? I tried hist->SetMarkerSize but it seems not working.

Change the marker style tree->SetMarkerStyle(20) the marker style use by default is dot and its size cannot be changed.

  • What is the use of TH1::GetListOfFunctions. I found a TObjArray called graphs after printing it out. What are object and class saved in this array? I tried to call TObject::Print by dereferencing each object and it returns me a (x, y) pair.

The a collection TGraph is used to draw le dot.

  • If I would like to create a TPolyMarker3D, how can I draw it in a flat view like TH2::Draw("COLZ")?

A TPolyMarker3D is 3D. to make a flat view use TGraph

Many thanks for your kind reply!

I tried the following macro but I found the markers are still too small to visualize.

void testntuple()
 {
     TNtuple* tp = new TNtuple("tp", "tp", "x:y:count");
     constexpr int n = 10;
     float p[3];
     for (int i=0; i<n; ++i) {
         p[0] = gRandom->Uniform(0, 1);
         p[1] = 2 + gRandom->Uniform(0, 1);
         p[2] = i;
         tp->Fill(p);
     }
     TCanvas* c = new TCanvas("c", "c", 800, 600);
     tp->Draw("y:x:count >> hist1", "", "COLZ");
    std::cout << tp->GetMarkerSize() << "\n"; // return 1
     tp->SetMarkerSize(tp->GetMarkerSize() * 100);
     tp->SetMarkerStyle(20);
 }
void testntuple() {
   TNtuple* tp = new TNtuple("tp", "tp", "x:y:count");
   constexpr int n = 10;
   float p[3];
   for (int i=0; i<n; ++i) {
      p[0] = gRandom->Uniform(0, 1);
      p[1] = 2 + gRandom->Uniform(0, 1);
      p[2] = i;
      tp->Fill(p);
   }
   tp->SetMarkerSize(2.);
   tp->SetMarkerStyle(20);
   tp->Draw("y:x:count", "", "COLZ");

}

Thanks so much! It seems that marker setting must be done before drawing.

I still have a couple of question.

  • Can I change the color bar?
  • Can I layout different scatter plots on the same coordinates (X, Y, Color)?

The following macro shows my desire. I would like to have same effects without histogram binning

void testth2()
 {
     TCanvas* c = new TCanvas("c", "", 800*2, 600);
     c->Divide(2, 1);
 
     TH2* h1 = new TH2F("h1", "", 30, 0, 3, 30, 0, 3);
     TH2* h2 = new TH2F("h2", "", 30, 0, 3, 30, 0, 3);
 
     h1->SetStats(0);
 
     for (int i=1; i<=30; ++i) {
         for (int j=1; j<=30; ++j) {
 
             if ( i< 10 && j < 10) {
                 h1->SetBinContent(i, j, i+j);
             }
             if ( j< 30 && j > 20 && i<30 && i>20) {
                 h2->SetBinContent(i, j, i+j);
             }
         }
     }
 
     TLatex* tex = new TLatex();
     c->cd(1);
 
     h1->DrawCopy("COLZ");
     h2->DrawCopy("COLZ SAME");
     tex->DrawLatexNDC(0.1, 0.8, "Default h1 [min, max]");
 
     c->cd(2);
     h1->SetMaximum(100);
     h1->Draw("COLZ");
     h2->Draw("COLZ SAME");
     tex->DrawLatexNDC(0.1, 0.8, "Changed h1 [min, max]");
 }

  • Can I change the color bar?

gStyle->SetPalette()

  • Can I layout different scatter plots on the same coordinates (X, Y, Color)?

You can draw the next one using option “SAME”. but the dynamic of the two plot should be the same I guess.

Thanks so much for your help and patience!

I may rephrase the question a bit.
I tried the “same” option and get an error,

Error in <TSelectorDraw::Begin>: You cannot use option same when no 3D view exists

I posted the full macro below:

void testtgarph2()
{
    TCanvas* c = new TCanvas("ctestgraph2", "testgraph2", 800*2, 600);
    c->Divide(2, 1);    
    TNtuple* t1 = new TNtuple("t1", "t1", "x:y:z");
    TNtuple* t2 = new TNtuple("t2", "t2", "x:y:z");    
    for (int i=0; i<10; ++i) {
        for (int j=1; j<10; ++j) {
            t1->Fill(i, j, i+j);
            t2->Fill(i+10, j+10, i+j+50);
        }
    }
    TLatex* tex = new TLatex();
    c->cd(1);
    t1->SetMarkerStyle(20);
    t1->SetMarkerSize(2);
    TH2F* hist1 = new TH2F("hist1", "", 10, 0, 20, 10, 0, 20);
    hist1->SetStats(0);
    hist1->SetMaximum(50);
    hist1->SetMinimum(0);
    hist1->GetXaxis()->SetRangeUser(0, 20);
    t1->Draw("x:y:z >> hist1", "", "COLZ");
    // The following cannot modify the plot.
    // The range of color axis has changed but colors of each point do not.
    // t1->Draw("x:y:z", "", "COLZ");
    // auto htemp = (TH2F*) gROOT->FindObject("htemp");
    // htemp->SetMaximum(50);
    // htemp->SetMinimum(0);
    // htemp->GetXaxis()->SetRangeUser(0, 20);
    // c->Update();
    // t2->Draw("x:y:z", "", "COLZ same");
    c->cd(1)->Update();
    tex->DrawLatexNDC(0.1, 0.8, "Default h1 [min, max]");
    c->cd(2);
    tex->DrawLatexNDC(0.1, 0.8, "Changed h1 [min, max]");   
    c->Draw();
 }

And it seems that I cannot modify the color of markers to fit the new range of color axis. See comment area in the code block above.

The questions are

  • Is there any workaround to make color changed automatically according to the range of color bar?
  • Is there a way to layout two plots under the same range of color axis, like what I posted using TH2F?

Ok, I am sorry but you cannot achieve what you are looking for using this method. You need TScatter for that.

In any case, to make that work with TTree::Draw (ie option SAME with
x:y:z and COLZ) would require a change which mean you will need to have the latest ROOT in which TScatter is implemented.