Dear Experts! @moneta
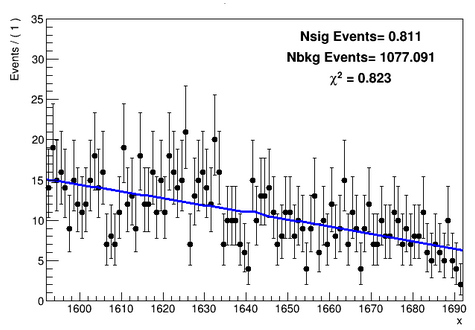
I am finding Upper limit on Number of signal counts using “Model(Nsig * gauss + Nbkg * poly) * Constraints terms”. I was looking for a Gaussian signal at x = 1642 and as you can see in the following plot that i didn’t see any signal at this value so i want to put limit on Nsig.
I tried to extract upper limit using AsymptoticCal in StandardHypoTestInvDemo.C. What I did is:
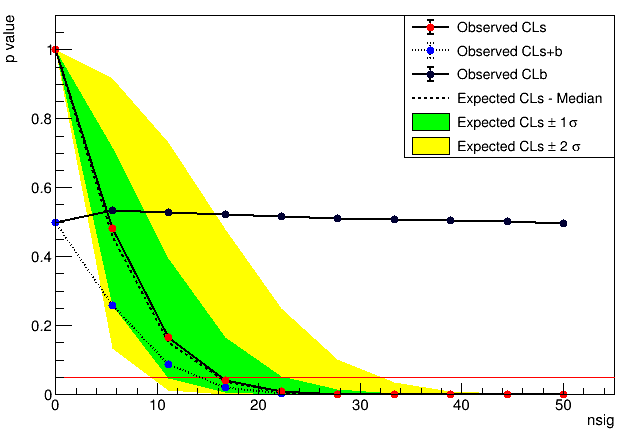
$ StandardHypoTestInvDemo(“file.root”, “w”, “ModelConfig”, “”, “dh”, 2, 3, 1, 10, 0, 50) and got this pValue plot.
At first i didn’t fully understand this plot but after reading this discussion A root file produced by RooClassFactory::makePdf() Crashed - #12 by moneta I proceed my analysis like this.
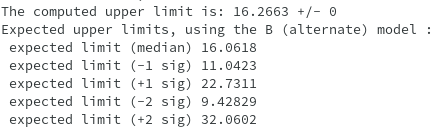
As in my Scan plot, CLs+b < CLb and if i follows the above discussion, then nsig = 14 (i.e. the point where observed CLs+b touches the 0.05 plane red line) is the upper limit for nsig. And as for nsig > 14, CLs+b is smaller than 0.05, so i can reject the S+B null hypothesis and set a 95% limit for nsig at around 14. But my output results shows something different. It shows Upper computed upper limit as 16.266, which is the point where Expected CLs-Median intersects 0.05 red line.
- I am confused among these two concepts. I don’t fully understand, how should i predict my results?
- Also if CLs+b and CLb are enough to predict results why we used Observed and Expected CLs? And does Expected-CLs means “Expected for no-signal” ?
BTW, I also tried frequentist approach and upper limit is more or less same as nsig ~16.
Waiting for your kind and quick responses.
Thank you in Advance!
Hi,
Looking at your plot I see that the CLs line crosses the 0.05 line at around 16, so this is what the macro prints as upper limit. The normal procedure is to use as upper limit, CLs = CL(s+b)/CL(b) in order to avoid having artificial very tight limits when CLb is very small.
The expected limit is the limit obtained not using the observed data, but your nominal model values. It gives you an idea what is the sensitivity of your analysis. In your case you are observing data values perfectly compatible with your background model .
If you have further questions, please let me know
Best regards
Lorenzo
Dear Lorenzo,
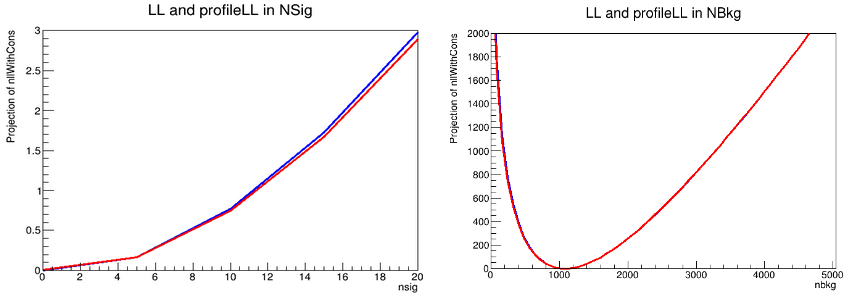
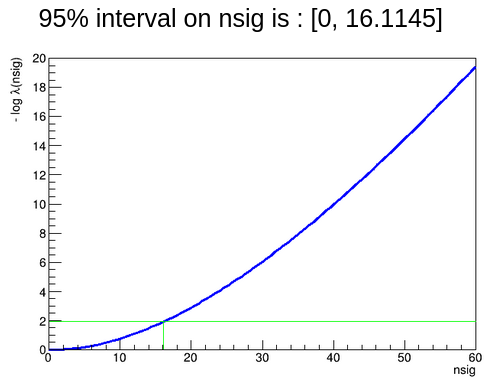
Thank you very much for such a nice explanation. I have one more question. I also extract Upper limit using ProfileLikelihoodCalculator directly i.e.
ProfileLikelihoodCalculator pl(*data,mc);
pl.SetConfidenceLevel(0.95); //95% interval
LikelihoodInterval interval = pl.GetInterval();
whose results are also comparable to HypotestInv method, see below.
I am wondering what is the difference between two methods? I mean in HypoTestInv method, we are using hypothesis tests using Asymptotic formulas + profile likelihood calculator but what about direct ProfileLikelihoodCalculator?
And which method is more authentic to present results? Asymptotic, Frequentist or ProfileLikelihoodCalculator method ?
Thank you!
Hi,
The ProfileLikelihoodCalculator uses just the observed likelihood function to compute the limit, and it is also valid in the asymptotic case. It is normally more appropriate to compute an interval than a limit, so in this gives the same result, but because your observed data are giving a best fit value of nsig=0.
What is generally (at least in the LHC experiments) to compute a limit is to use the Frequentist procedure and whenever possible (i.e in case of statistics not too small) to use the Asymptotic method.
In general, if possible, it is nice to verify that the Asympototic result is compatible with the Frequentist.
The Profile Likelihood method instead is more recommended for reporting a double side interval.
Best regards
Lorenzo
Hello,
Alright, That helps alot.
Just to make sure, when you said earlier that “The expected limit is the limit obtained not using the observed data, but your nominal model values” , what do you mean by nominal model? Is it Alternate hypo(B-only) model?
To be honest, i didn’t fully get these expected values.
Thank you for your time and help. I really appreciate it.
The expected limit is computed by replacing the data observed value with the median B-only modulo values.
For example you have an experiment where you observed 2 events and you expect in average 1.5 events from the background model. The expected limit then will be the one computed assuming that you observe 1.5 events.
Cheers
Lorenzo