Dear root experts,
I’m trying to scale a total sum of histograms that I made by using THStack.
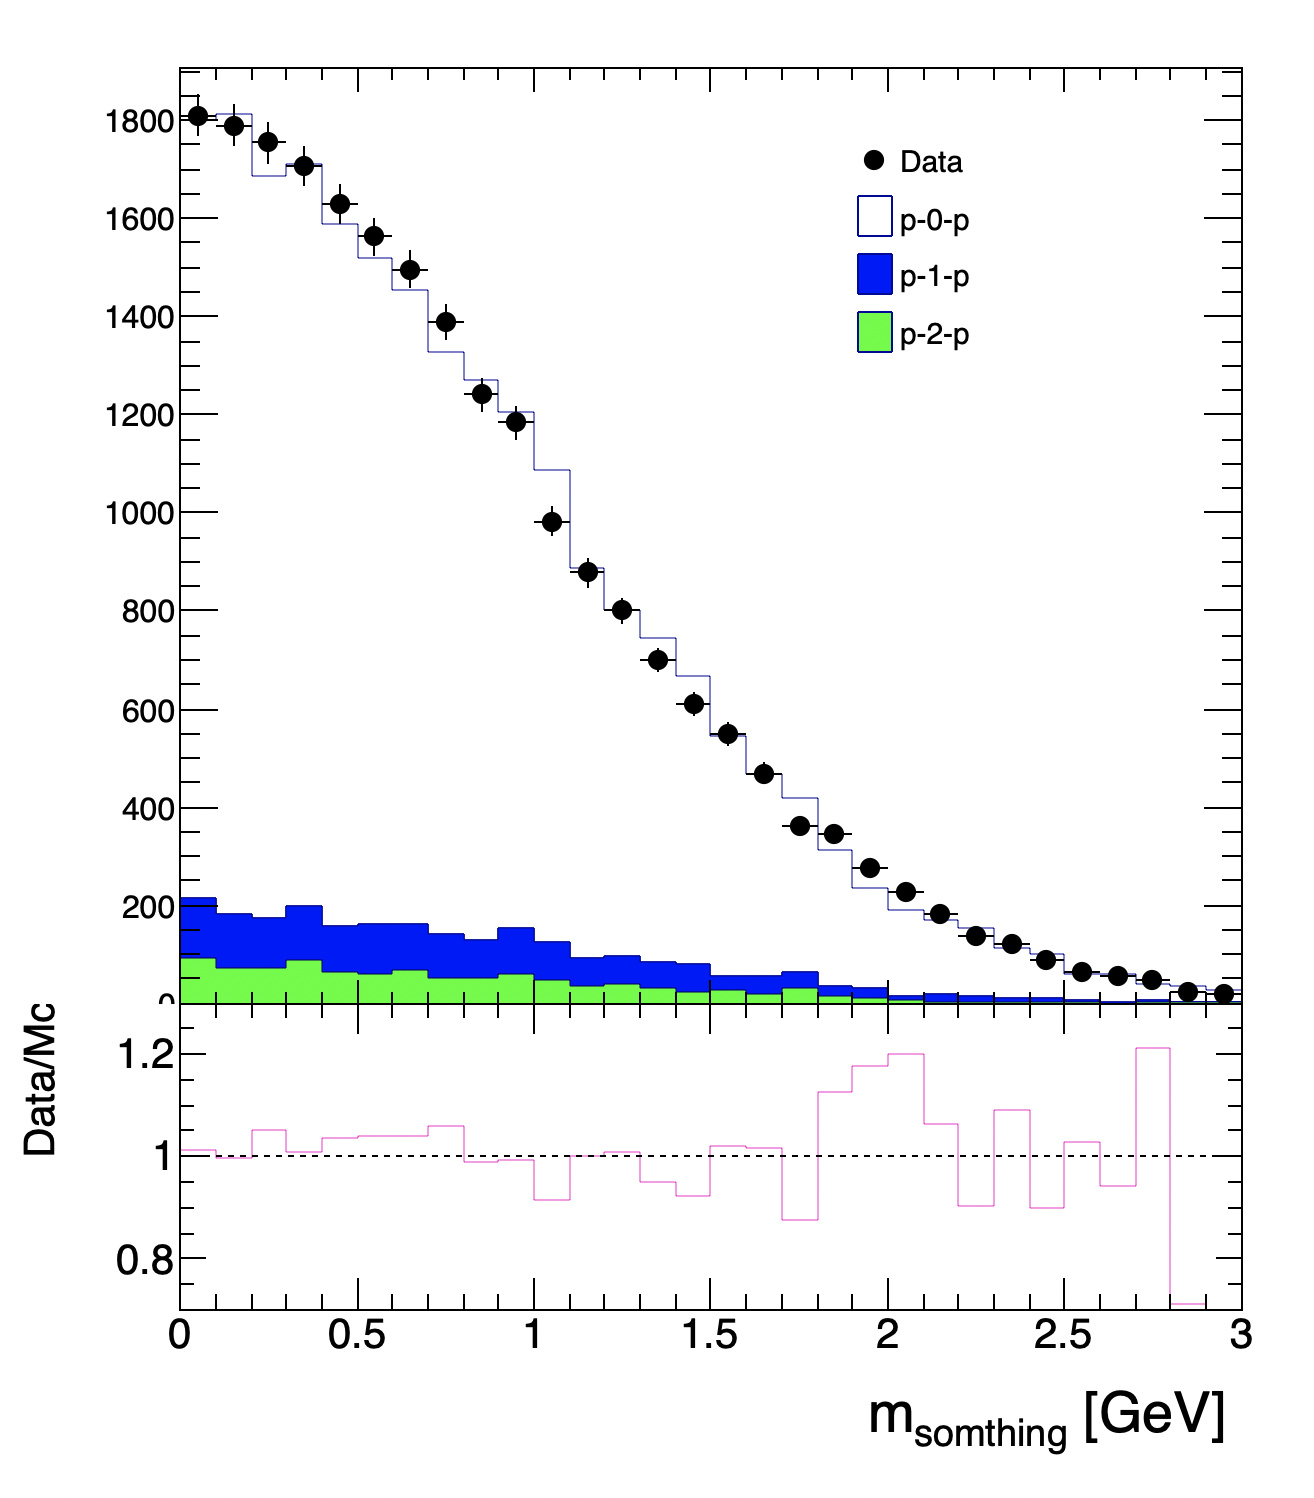
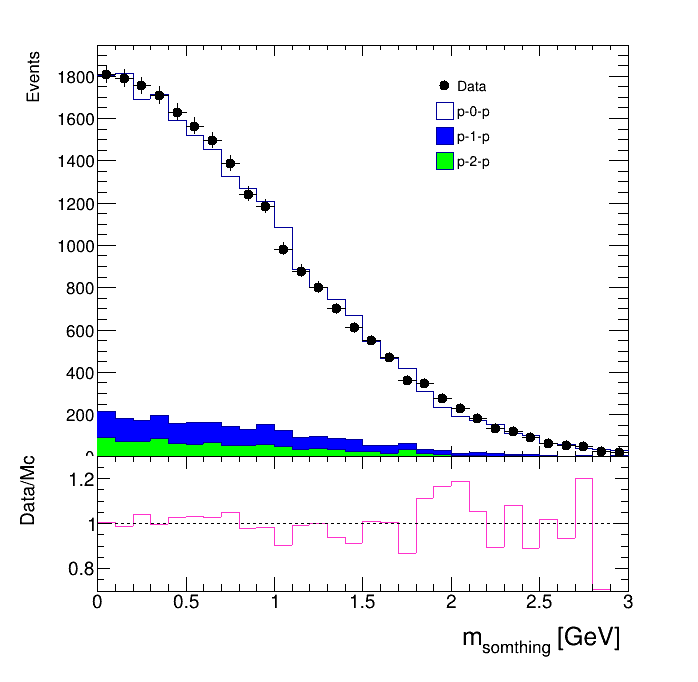
What I want to see is a scaled blue histogram instead of the current one. The ratio plot seems to work fine with the scaling. I followed this link but I didn’t get it right!
Any help will be much appreciated. Thanks.
Here’s what I tried:
void scale(){

    TCanvas *can   =new TCanvas("plot","plot",700,800);
    gStyle->SetOptStat(0);
    gPad->SetLeftMargin(0.18);
    can->SetTickx(1);
    can->SetTicky(1);

    TPad *pad1 = new TPad("pad1", "pad1", 0.00, 0.33, 1.00, 1.00);
    TPad *pad2 = new TPad("pad2", "pad2", 0.00, 0.00, 1.00, 0.33);

    THStack *hs = new THStack("hs","");
    THStack *hs1 = new THStack("hs1","");

    pad1->SetBottomMargin(0.00001);
    pad1->SetBorderMode(0);
    pad1->SetLeftMargin(0.14);
    pad1->SetTickx(1);
    pad1->SetTicky(1);
    pad2->SetTopMargin(0.00001);
    pad2->SetBottomMargin(0.4);
    pad2->SetBorderMode(0);
    pad2->SetLeftMargin(0.14);
    pad2->SetTickx(1);
    pad2->SetTicky(1);
    gStyle->SetOptTitle(kFALSE);
    pad1->Draw();
    pad2->Draw();
    pad1->cd();

   THStack *hstack = new THStack("hstack","Scaling hstack");
   TH1F *data = new TH1F("data","",30,0,3);
   TH1F *h1   = new TH1F("h1","",30,0,3);
   TH1F *h2   = new TH1F("h2","",30,0,3);
   TH1F *h3   = new TH1F("h3","",30,0,3);
   TH1F *h4   = new TH1F("h4","",30,0,3);

   data->FillRandom("gaus",22500);
   data->Draw("e");
   data->SetMarkerStyle(20);
   data->SetMarkerSize(1.2);
   data->SetLineColor(kBlack);
   data->GetYaxis()->SetTitle("Events ");
   //data->GetYaxis()->SetTitleOffset(1.5);
   data->GetXaxis()->SetTitleFont(42);
   data->GetXaxis()->SetTitleSize(0.04);
   data->GetYaxis()->SetLabelSize(0.04);
   data->GetYaxis()->SetTitleFont(42);
   data->GetYaxis()->SetTitleSize(0.04);


   h1->FillRandom("gaus",20000);
   //h1->SetFillColor(kRed);
   h1->SetMarkerStyle(21);
   h1->SetMarkerColor(kRed);

   h2->FillRandom("gaus",1500);
   h2->SetFillColor(kBlue);
   h2->SetMarkerStyle(21);
   h2->SetMarkerColor(kBlue);

   h3->FillRandom("gaus",1000);
   h3->SetFillColor(kGreen);
   h3->SetMarkerStyle(21);
   h3->SetMarkerColor(kGreen);

   hstack->Add(h3);
   hstack->Add(h2);
   hstack->Add(h1);
//   hstack->Add(h4);


  hstack->Draw();
  data->Draw("e, same");

  TH1F *h = new TH1F(*((TH1F *)(hstack->GetStack()->Last())));

    double N_of_bkg   = h->Integral(7, 30);
    double N_of_data = data->Integral(7, 30);

    std::cout<<" N of bkg "<<N_of_bkg<<", and "<<"N of data: "<<N_of_data<<". "<<"Ratio Data/SM: "<<N_of_data/N_of_bkg<<std::endl;

    h->Scale(N_of_data/N_of_bkg);


    TLegend *leg = new TLegend(0.62,0.62,0.76,0.84,NULL,"brNDC");
    leg->SetBorderSize(0);
    leg->SetTextAlign(12);
    leg->SetTextFont(42);
    leg->SetTextSize(0.03230543);
    leg->SetLineColor(1);
    leg->SetLineStyle(1);
    leg->SetLineWidth(1);
    leg->SetFillColor(0);
    leg->SetFillStyle(1001);
    leg->AddEntry(data,"Data","P");
    leg->AddEntry(h1 ,"p-0-p","f");
    leg->AddEntry(h2,"p-1-p","f");
    leg->AddEntry(h3,"p-2-p","f");
    leg->Draw();

    can->Update();


  pad2->cd();
    // Calculating the sum manuly and then get the ratio plot.
    //TH1F* total1=(TH1F*) ttbar->Clone("total1");
    //total1->Add(Wt);
    //TH1F* total2=(TH1F*) Zjet->Clone("total2");
    //total2->Add(Diboson);
    //TH1F* total3=(TH1F*) Mis_ID_lepton->Clone("total3");
    //total3->Add(total2);
    //TH1F* totalMc=(TH1F*) total1->Clone("totalMc");
    //totalMc->Add(total3);


    for(int l = 0; l< data->GetNbinsX(); l++) {
     h4->SetBinContent(l+1, data->GetBinContent(l+1)/h->GetBinContent(l+1));
    }


    h4->SetLineColor(kPink+9);
    h4->GetXaxis()->SetTitle("m_{somthing} [GeV] ");
    h4->GetXaxis()->SetLabelSize(0.09);
    h4->GetXaxis()->SetTitleSize(0.12);
    h4->GetXaxis()->SetTickLength(0.08);
    h4->GetXaxis()->SetTitleOffset(1.163);

    h4->GetXaxis()->SetTitleFont(42);
    h4->GetYaxis()->SetTitle("Data/Mc");
    h4->GetYaxis()->SetLabelSize(0.09);
    h4->GetYaxis()->SetTitleSize(0.09);
    h4->GetYaxis()->SetTitleOffset(0.7);
    h4->GetYaxis()->SetNdivisions(404,kTRUE);
    h4->SetStats(false);
    h4->SetMaximum(1.3);
    h4->SetMinimum(0.7);
    h4->Draw("histo");

    TLine *line = new TLine();
    line->SetLineStyle(2);
    line->SetLineWidth(1);
    line->SetLineColor(kBlack);
    line->DrawLine(h4->GetXaxis()->GetXmin(), 1  , h4->GetXaxis()->GetXmax(), 1  );
}