TL; DR
- ROOT I/O does not scale too well on the original dataset (but better now with a few patches I added). However, runtimes of O(few seconds) at high core counts and different behavior with larger datasets make this a “weird” corner of the phase space
- on an artificially enlarged dataset,
root-readspeed scales well but the RDF macros showed a different scaling problem (a long-standing false sharing issue); with a dedicated patch, things look good for the RDF macros too
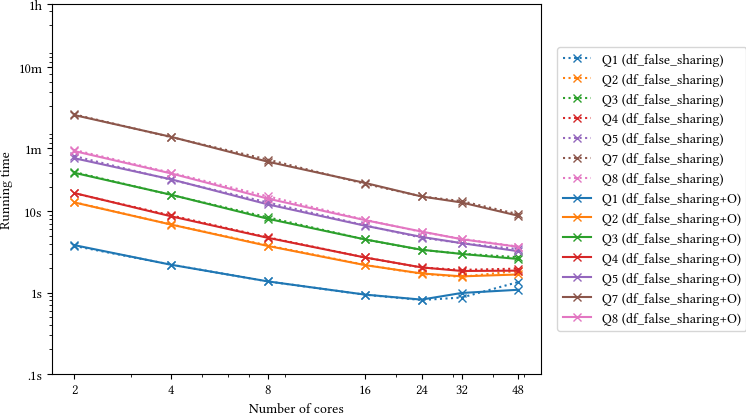
- compiled versions of the RDF macros that @swunsch kindly implemented improve runtimes up to 3x
Summary
Running on the original dataset, both root-readspeed and the opendata benchmarks don’t scale very well, but after fixing a few issues I got some improvements: an 18.7x speed-up at 64 cores w.r.t. to the single-core run with root-reasdpeed, and a 15.9x speed-up with the benchmark8 macro. In both cases, CPU utilization is low (e.g. root-readspeed at 64 cores only yields 3336% average CPU utilization), which indicates threads are scheduled out of CPUs because of lock waits or similar (could also be because of I/O waits, but it’s not likely in this setup). I am still investigating what causes this exactly: the fact that it happens with root-readspeed indicates an issue with ROOT I/O; however, total runtimes in this scenario are in the order of few seconds, where load imbalances and lock contention at thread start-up play a much more important role than in longer-running analyses. And anyway 7 seconds is a totally ok runtime to have a quick turnaround cycle, as long as higher workloads do not suffer from this same issue.
So I ran the tests with an artificially enlarged dataset (90x the original data for root-readspeed, 20x the original data for the opendata benchmarks).
In that setting, CPU utilization is good (e.g., for root-readspeed with the latest patches, 6086% for 64 cores), and scaling of root-readspeed is good (~45x speed-up with 64 cores w.r.t. the single-core wall-clock time; looking at Amdahl’s law, that’s a very good scaling: as if 99.4% of the original single-thread workload was perfectly parallelized).
The RDF benchmarks, however, showed good CPU utilization but worse scaling than root-readspeed. perf points to a false-sharing problem in RFilter::CheckFilters and RDefine::Update. With a patch that removes the false sharing, the RDF macros are now also well behaved, e.g. benchmark #8 now has a 38x speed-up w.r.t. the single-core version for the macro, 35x for the compiled, optimized version (which is also 3x faster).
Benchmark setup
Data always read from the filesystem cache.
root-readspeed invocation as above:
./root-readspeed/build/src/root-readspeed --trees Events --files data/Run2012B_SingleMu.root \
               --branches nMuon Muon_pt Muon_eta Muon_phi Muon_mass Muon_charge MET_pt \
               --threads $t
Using /usr/bin/time to collect CPU %usage.
Machine CPU specs:
Architecture:        x86_64
CPU op-mode(s):      32-bit, 64-bit
Byte Order:          Little Endian
CPU(s):              128
On-line CPU(s) list: 0-127
Thread(s) per core:  2
Core(s) per socket:  64
Socket(s):           1
NUMA node(s):        1
Vendor ID:           AuthenticAMD
CPU family:          23
Model:               49
Model name:          AMD EPYC 7702P 64-Core Processor
Stepping:            0
CPU MHz:             2000.000
CPU max MHz:         3353.5149
CPU min MHz:         1500.0000
BogoMIPS:            3992.45
Virtualization:      AMD-V
L1d cache:           32K
L1i cache:           32K
L2 cache:            512K
L3 cache:            16384K
NUMA node0 CPU(s):   0-127
Max speed reached when reading the data from filesystem cache with dd is ~12GB/s:
$ dd if=../data/Run2012B_SingleMu.root of=/dev/null bs=200k
84482+1 records in
84482+1 records out
17301918071 bytes (17 GB, 16 GiB) copied, 1.39704 s, 12.4 GB/s
Benchmark outputs and further discussion
root-readspeed scaling with the latest patches on a dataset 90x times the original
#threads        Throughput (MB/s)       %CPU
0               95.6228                 99
2               187.517                 199
4               369.332                 392
8               743.988                 780
16              1463.24                 1550
32              2752.07                 3085
48              3699.3                  4602
64              4412.84                 6063
This is a 46x speed-up with respect to the single-thread case with 64 threads. That is very good according to Amdahl’s law (it’s as if 99.4% of the single-thread runtime was perfectly parallelized between the 64 threads – there might be a number of effects that come into play here to the advantage of the multi-thread run, but the point remains that the observed scaling is very good in this case).
root-readspeed scaling on the original dataset
Before patches:
#threads   Throughput (MB/s)   %CPU
0                     93.255     99
2                    185.494    194
4                    356.754    378
8                    675.031    716
16                   1181.63   1310
32                   1210.60   1602
48                   1113.97   1673
64                   1069.62   1810
After patches:
#threads   Throughput (MB/s)   %CPU
0                      94.10     99
2                     182.49    195
4                     364.39    381
8                     676.34    713
16                   1210.47   1309
32                   1947.17   2214
48                   2375.57   2858
64                   2516.84   3336
That’s a 26x speed-up with 64 threads. Not terrible, and definitely better than a slow-down (like in some cases @ingomueller.net reported) but not fantastic either.
I can see that CPU usage is low with little data and gets better and better with more and more data. Running root-readspeed with a fixed 64 threads:
#files   Throughput (MB/s)  %CPU
1        2495.52            3309
2        2880.08            4259
5        3603.36            5190
10       3984.13            5594
20       4210.87            5829
40       4389.58            5971
60       4455.99            6021
80       4423.99            6012
90       4467.27            6086
One part of the problem is that we have a high amount of lock contention at start-up, when all 64 threads want to prepare ROOT I/O for reading the data – and given that the total runtime is O(1s), that warm-up phase weights a lot. Workload imbalance might also play a role, with tails in which many threads ran out of things to do that last for a significant fraction of the total runtime of few seconds.
However, I’d like the computer to tell me exactly why CPU usage is low: why are the threads going idle? What are they waiting on? The best I could do was this off-CPU flamegraph which should summarize the reasons why threads are scheduled out of the CPUs but does not correspond to my mental model of what’s happening much and is definitely missing information, so meh. So this story isn’t over (but it only regards workloads that take a few seconds on 48/64 CPUs).
Open data RDF benchmark #8
Taking benchmark #8 (one of those with bad scaling over 16 cores in Ingo’s tests), here’s what I see with the original workload (these are wall-clock times for the execution of the full script):
threads  time (s) [speed-up]   [%CPU]
1           114.23     [1.00]    [99%]
2            68.82     [1.65]   [192%]
4            40.67     [2.81]   [365%]
8            24.07     [4.75]   [667%]
16           15.29     [7.47]  [1175%]
32            9.85    [11.60]  [1855%]
48            8.60    [13.28]  [2298%]
64            8.01    [14.26]  [2668%]
Here RDF suffers from the same low CPU usage issue that we saw for root-readspeed but the extra work performed during the event loop (especially for the more “beefy” tasks) makes it a bit less of a concern. With a 20x bigger dataset:
threads  time (s) [speed-up]    [%CPU]
1          2312.99     [1.00]     [99%]
2          1329.10     [1.74]    [197%]
4           738.78     [3.13]    [391%]
8           398.64     [5.80]    [778%]
16          220.58    [10.48]   [1541%]
32          120.25    [19.23]   [3024%]
48           87.42    [26.46]   [4481%]
64           70.08    [33.00]   [5878%]
So, at least on this machine I actually don’t see as terrible a scaling behavior as the one initially reported by Ingo,
but a 14x speed-up with 64 threads is still not great. Luckily, this time CPU %usage was good in all cases, so the problem must have been different from the issue root-readspeed encounters (which causes low CPU %usage), so I took a look at whether something could be done.
Results with a fix for false sharing issues in RDataFrame
As @amadio pointed out several times before, RDF has false sharing problems: Filters and Defines, in each thread, read and write different but contiguous elements of std::vector<T>s.
If the workload of filters and defines is relatively small (as it happens for instance with Filter("AdditionalLepton_pt != -999") then the false sharing becomes a bottleneck.
With this patch the numbers become, for the original workload:
threads  time (s) [speed-up]    [%CPU]
1          119.00     [1.00]     [99%]
2           67.48     [1.76]    [191%]
4           37.40     [3.18]    [359%]
8           21.26     [5.60]    [652%]
16          12.93     [9.20]   [1091%]
32           9.00    [13.22]   [1680%]
48           7.88    [15.10]   [2097%]
64           7.48    [15.91]   [2355%]
Here the false sharing is fixed so CPU usage actually drops a bit as we go back to the ROOT I/O bottleneck.
For the 20x bigger dataset:
threads  time (s) [speed-up]    [%CPU]
1         2328.16     [1.00]     [99%]
2         1271.88     [1.83]    [196%]
4          660.75     [3.53]    [394%]
8          349.16     [6.67]    [778%]
16         182.78    [12.74]   [1535%]
32         100.28    [23.21]   [3017%]
48          74.34    [31.32]   [4432%]
64          61.09    [38.11]   [5835%]
Much better!
Conclusions
Please don’t use the opendata benchmarks as an indicator of performance of real-world analysis tasks at high core counts, they were not designed as such and happen to hit a corner of the phase space where ROOT I/O performs pretty badly (at high core counts). However the performance on this benchmarks is simply not indicative of the performance you will get with a realistic workload – unless your workload is really as small as in those benchmarks, in which case you will get total runtimes of O(few seconds), which I guess is totally ok anyway.
We will upstream the optimized versions of the RDF benchmarks; the root-readspeed patches are already in, the RDataFrame patches will be merged in master as soon as possible (might need some tweaks to make them prettier). We are now tracking both the version with just-in-time compilation and the fully compiled one for each benchmark as part of rootbench, so I might reply here again in case we introduce performance optimizations that impact them.
Ingo, it would be great if you could check what performance you see for the RDF benchmarks with the RDF patch applied.


 but also: variance between analyses is large – the issue is not as much that the dataset size you used is not representative of any realistic use case, it’s just that (from what I see in my tests) the conclusions about scaling that you can draw on experiments at that scale do not apply to larger datasets – you can’t generalize them.
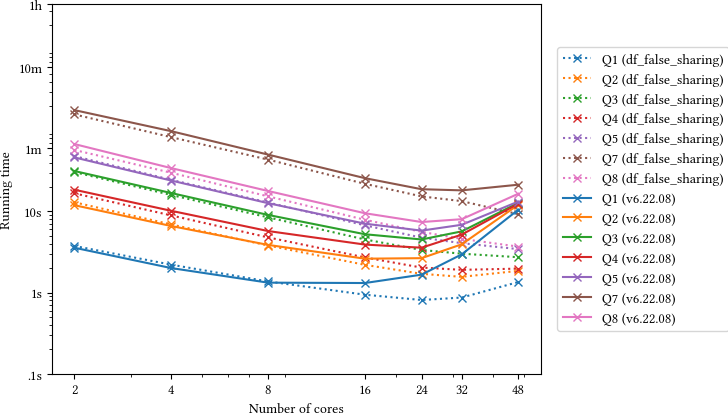

