Scalability of RDataFrames on 16+ cores

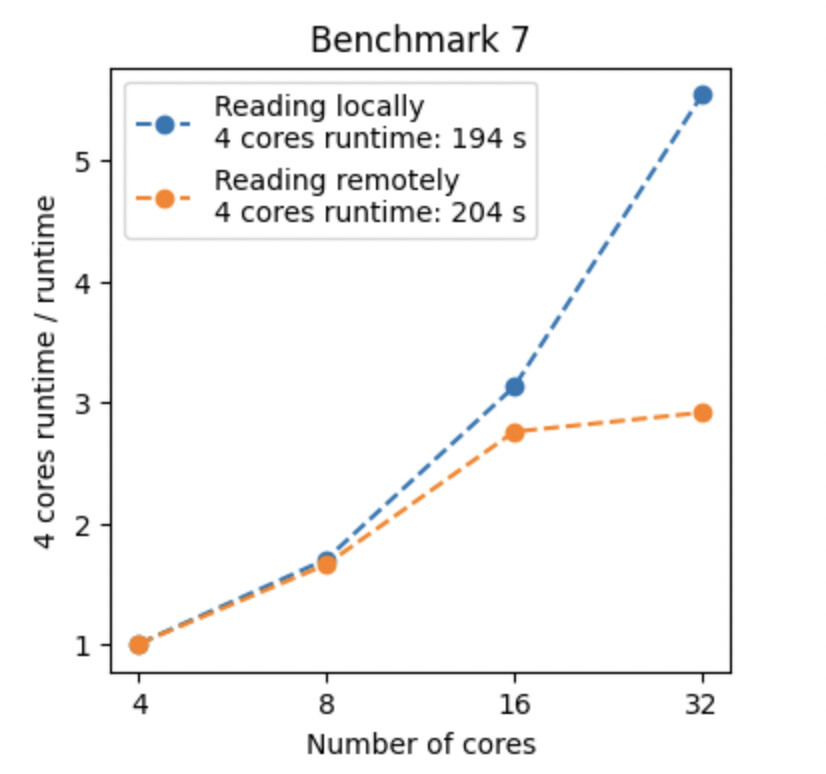
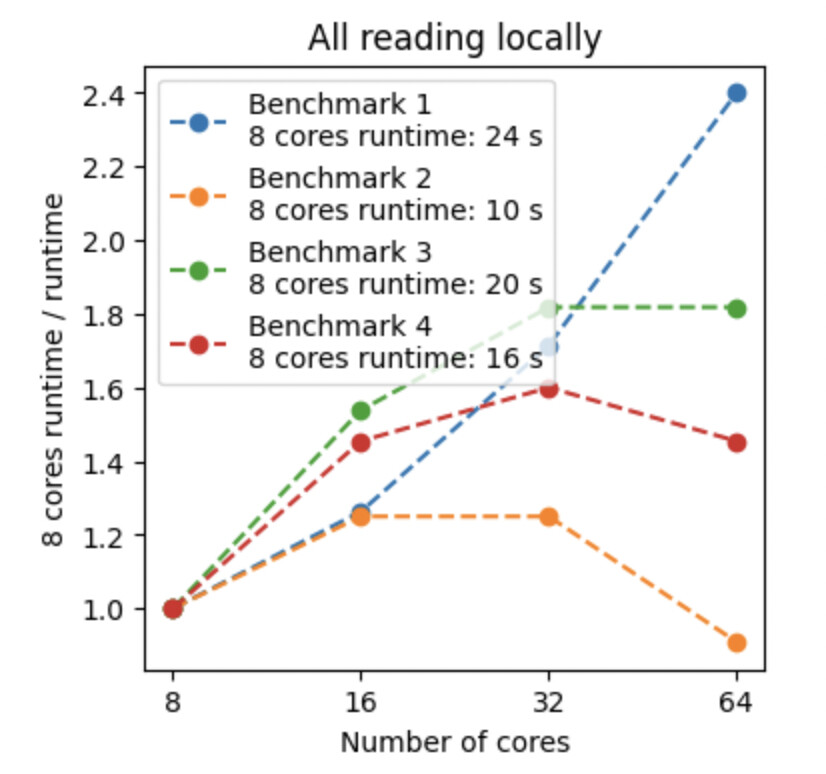
I am currently running some performance tests of the ROOT framework using this benchmark and I am encountering unexpected behavior: I have run the queries of the benchmark using various instances sizes on EC2 (all m5d instance sizes, to be precise), which have between 2 and 48 physical cores, and observed that the running time only improves until 8 to 16 cores and gets significantly worse after that (see plot.pdf (378.7 KB)) With some queries, using 48 cores is slower than using just 2 cores.

Is this a known behavior, and if yes, is there an easy fix?

You should be able to fully reproduce what I did the following way: I am using the Docker image from
Docker Hub and GitHub - masonproffitt/opendata-benchmarks: Example repository showing benchmarks with open data. I use the Docker image like so:

docker run --rm \
        -v /path/to/benchmark/data/:/data/:ro \
        masonproffitt/rdataframe-benchmarks:0.0 \
            /root/util/run_benchmark.sh \
                -n 3 \
                $query_id \
                "/data/Run2012B_SingleMu.root" \
                true

This assumes that you have downloaded the benchmark data from root://eospublic.cern.ch//eos/root-eos/benchmark/Run2012B_SingleMu.root to /path/to/benchmark/data/ (which should also work on EC2 in case you want to use the same hardware as I did).

ROOT Version: 6.22.08 (via official Docker image rootproject/root:6.22.08-ubuntu20.04)

Hi @ingomueller.net ,
we have evidence of good scaling with RDF up to 128 physical cores for certain use-cases, so RDF can scale well, but actual performance of course depends on the particular usecase. Network bandwidth (or slow disks) might get chocked, the dataset might be too small to parallelize well on 48 cores (you would need at least ~500 TTree clusters for that), the 48 cores might be on different NUMA domains (so you might need to apply task pinning), etc.

The code in those benchmarks is also not optimized for performance but rather readability (note to @swunsch : there is a lot of jitting and interpreted macros in that repo. Given that people use it to get a measure of RDF performance, we should probably revise that code).

This experimental tool should help you figure out whether the issue is an I/O bottleneck or not: GitHub - eguiraud/root-readspeed: A tool to measure what throughput can be expected from ROOT for a given application. .

On our side we can provide RDF code that should in general perform better and that can be profiled e.g. with perf record, and that should provide some more info about where the bottleneck is. Which of the benchmarks do you think would be the most interesting to optimize first?

Let us know if you are up for trying running root-readspeed, we’ll be in touch.

Cheers,
Enrico

Hi!

Indeed, as @eguiraud mentioned, the RDF code was primarily about programming model rather performance and all of this got now a little bit out of hand :wink: Jitting and too many allocations (due to missing small buffer optimization in RVec) may be an issue. But fair enough, we should also scale with the nicely readable code!

I’m having a look into this. Let’s see what scaling I get on my machine(s).

@eguiraud The file has 17GB and 544 clusters, but we read only a small fraction of it. (If you wonder how to get this number, run rootls -t file.root.)

Best
Stefan

I’m already hitting the IO bottleneck at 16 cores for benchmark 7:

Hi @eguiraud,

Thanks a lot for the quick reply. I just ran a quick test with root-readspeed on the largest instance types, which have 48 cores and 4 SSDs configured as RAID 0 (to maximize bandwidth). The machine has 380GB of DRAM and I did some warm-up runs, so the benchmark should actually read from the OS cache. Just to be sure, I also ran the following test with dd (the RAID is mounted to /data/):

$ echo 3 | sudo tee /proc/sys/vm/drop_caches
3
$ dd if=/data/input/Run2012B_SingleMu.root of=/dev/null bs=1M count=16k
16384+0 records in
16384+0 records out
17179869184 bytes (17 GB) copied, 4.23678 s, 4.1 GB/s
$ dd if=/data/input/Run2012B_SingleMu.root of=/dev/null bs=1M count=16k
16384+0 records in
16384+0 records out
17179869184 bytes (17 GB) copied, 2.59621 s, 6.6 GB/s

Now the result with root-readspeed. I took the list of branches from Q5.

for t in 1 2 4 8 12 24 48; do echo "Threads:                        $t"; ./src/root-readspeed --trees Events --files /data/Run2012B_SingleMu_65536000.root --branches nMuon Muon_pt Muon_eta Muon_phi Muon_mass Muon_charge MET_pt --threads $t; echo; done
Threads:                        1
Real time to setup MT run:      0.0879152 s
CPU time to setup MT run:       0.1 s
Real time:                      17.8905 s
CPU time:                       17.88 s
Uncompressed data read:         1916353044 bytes
Throughput:                     102.153 MB/s

Threads:                        2
Real time to setup MT run:      0.0875871 s
CPU time to setup MT run:       0.08 s
Real time:                      9.15649 s
CPU time:                       18.32 s
Uncompressed data read:         1916353044 bytes
Throughput:                     199.594 MB/s

Threads:                        4
Real time to setup MT run:      0.0845201 s
CPU time to setup MT run:       0.09 s
Real time:                      4.87768 s
CPU time:                       19.24 s
Uncompressed data read:         1916353044 bytes
Throughput:                     374.681 MB/s

Threads:                        8
Real time to setup MT run:      0.087266 s
CPU time to setup MT run:       0.09 s
Real time:                      2.86205 s
CPU time:                       22.36 s
Uncompressed data read:         1916353044 bytes
Throughput:                     638.556 MB/s

Threads:                        12
Real time to setup MT run:      0.086822 s
CPU time to setup MT run:       0.09 s
Real time:                      2.34745 s
CPU time:                       25.06 s
Uncompressed data read:         1916353044 bytes
Throughput:                     778.538 MB/s

Threads:                        24
Real time to setup MT run:      0.0854959 s
CPU time to setup MT run:       0.09 s
Real time:                      4.99729 s
CPU time:                       40.51 s
Uncompressed data read:         1916353044 bytes
Throughput:                     365.713 MB/s

Threads:                        48
Real time to setup MT run:      0.0869319 s
CPU time to setup MT run:       0.09 s
Real time:                      12.566 s
CPU time:                       66.22 s
Uncompressed data read:         1916353044 bytes
Throughput:                     145.439 MB/s

From the README of root-readspeed, it seems like I am usually in the “decompression is the bottleneck” category. However, scalability is also limited to 8-12 cores with that tool.

The file is about 17GB large; that’s 360MB per physical core. Is that “too small”? As @swunsch found out, it seems to have enough clusters. (How can I find that out, BTW)?

As you guessed, the 48 cores are split over 2 NUMA nodes; however, I also run the above test on a single NUMA node, which shows a scalability problem as well:

for t in 1 2 4 8 12 24; do echo "Threads:                        $t"; taskset -c 0-23 ./src/root-readspeed --trees Events --files /data/Run2012B_SingleMu_65536000.root --branches nMuon Muon_pt Muon_eta Muon_phi Muon_mass Muon_charge MET_pt --threads $t; echo; done
Threads:                        1
Real time to setup MT run:      0.0933809 s
CPU time to setup MT run:       0.09 s
Real time:                      19.3513 s
CPU time:                       18.81 s
Uncompressed data read:         1916353044 bytes
Throughput:                     94.442 MB/s

Threads:                        2
Real time to setup MT run:      0.085289 s
CPU time to setup MT run:       0.08 s
Real time:                      9.43973 s
CPU time:                       18.89 s
Uncompressed data read:         1916353044 bytes
Throughput:                     193.605 MB/s

Threads:                        4
Real time to setup MT run:      0.085273 s
CPU time to setup MT run:       0.09 s
Real time:                      5.16885 s
CPU time:                       20.41 s
Uncompressed data read:         1916353044 bytes
Throughput:                     353.575 MB/s

Threads:                        8
Real time to setup MT run:      0.085464 s
CPU time to setup MT run:       0.08 s
Real time:                      2.89653 s
CPU time:                       22.65 s
Uncompressed data read:         1916353044 bytes
Throughput:                     630.955 MB/s

Threads:                        12
Real time to setup MT run:      0.0852692 s
CPU time to setup MT run:       0.08 s
Real time:                      2.51951 s
CPU time:                       25.38 s
Uncompressed data read:         1916353044 bytes
Throughput:                     725.371 MB/s

Threads:                        24
Real time to setup MT run:      0.0857332 s
CPU time to setup MT run:       0.08 s
Real time:                      4.7662 s
CPU time:                       39.32 s
Uncompressed data read:         1916353044 bytes
Throughput:                     383.445 MB/s

I understand that the RDataFrame implementations of the benchmark are not optimized for performance. However, (1) the performance is still interesting, since there is generally a trade-off between implementation time and obtained performance (though, I agree that a more optimized implementation with a different trade-off would be very interesting to compare!) and (2) I do not see yet why that should affect scalability rather than “just” general (single-core) efficiency.

Cheers,
Ingo

Another observation: The jitting time for the very short benchmarks (like benchmark 1), is in the order of 5-10s, but the runtime of the event loop is in the same order. So the scaling for these can be neglected because the hot loops does not dominate the overall runtime but all the infrastructure around it.

@swunsch: How exactly does that “jitting” work? Is this “real” jitting like in the JVM, which optimizes the code (iteratively) while it is running, or is it “just” jitting in the sense that the code is compiled while ROOT is running but the compilation is completed before the code is executed? Can I run hot code somehow in order to eliminate that effect?

In principle jitting is like compiling the program with for example clang, but on the fly during runtime of the macro. You can see it, performance wise, as happening single threaded before running the event loop.

If you want to remove this factor, you have to rewrite the benchmarks without any jitted code and then compile it, e.g. with clang -O3 benchmark.cxx $(root-config --cflags --libs). But take care, not only the macro is jitted, but also RDF jits code if you don’t fully specify the types, e.g., you have to put C++ callables in the Define and Filter nodes and no strings.

A potential answer to my own question: if the problem are many small allocations, then an unoptimized allocator could become contended with too many cores. However, the first four queries do not seem to do any allocations and actually have the worst scaling behavior, plus root-readspeed probably doesn’t do many small allocations and still suffers from the problem.

OK, thanks for the explanation. This sounds like the code is only compiled once, directly before it is executed. (The JVM is even more “just-in-time” as it may replace the compiled code several times with more optimized versions and even “de-optimize” if some assumptions don’t hold anymore.) If that is the case, then that single-threaded phase where the compilation happen can explain a scalability limit (due to Amdahl’s law) but not that running time increases with more cores.

OK, the fully compiled version is definitely an interesting option. Unfortunately, I won’t have time to explore it in the next few days and I might not immediately know how to do it (i.e., if you have time at some point to implement at least some of the benchmark queries, that would be awesome!).

Since you are not mentioning it, I suppose that the jitted code is not cached? I.e., I can’t just run the query twice and expect to have the jitting eliminated in the second run? (I have done that, actually, and the subsequent runs are about 0.5s faster.)

Here my runs for 8 to 64 cores with benchmarks 1 to 4:

I also wonder why the runtime goes up for 64 cores. But it’s most likely convoluted with the fact that the benchmarks have an extremely short runtime (< 30s already at 8 cores!). As you pointed out, Amdahl’s law prevents any scaling with jitting times in the order of seconds. My guess would be that the overhead of using 64 threads may degrade the performance if there’s too little work to do. Note that you also have to merge all the partial results from all the threads and a larger pool also brings additional overhead.

Regarding the jitting: No, it’s not cached between two runs of the same macro. So you pay the price of jitting again. The only way out is fully compiling the macro.

Let me have a look at the compiled performance :slight_smile:

@swunsch: Great! I guess it is good news that you can reproduce the problem.

I am not sure about the reason, though, yet. For example, I have run all queries on the 1000 first events of the full data set (using this file) and they all return is less than one second. If the jitting works the way I think it does, it also happens for that tiny data set to the full extend, so the sequential phase in the larger queries must be strictly less than 1 second as well.

Similarly, the merging of the results should be relatively cheap, at least in theory: they consist of ~100 bins per core. That’s just a few KB worth of data, which a single core could merge in at most a few milliseconds, no?

That’s interesting! So now we need a perf record output to see what’s going on :slight_smile:

Here an example for a fully compiled version of benchmark 4:

#include "ROOT/RDataFrame.hxx"
#include "TCanvas.h"

#include <iostream>

void benchmark4(const std::string input = "Run2012B_SingleMu.root", unsigned int cores = 128) {
    std::cout << "NCORES: " << cores << std::endl;
    ROOT::EnableImplicitMT(cores);

    ROOT::RDataFrame df("Events", input);

    using namespace ROOT::VecOps;
    auto h = df.Filter([](const RVec<float>& Jet_pt){ return Sum(Jet_pt > 40) >= 2; }, {"Jet_pt"})
               .Histo1D<float>({"", ";MET (GeV);N_{Events}", 100, 0, 2000}, "MET_pt");

    TCanvas c;
    h->Draw();
    c.SaveAs("benchmark4.root");
}

int main() {
    benchmark4();
}

You can compile this with gcc benchmark4.cxx -O3 $(root-config --cflags --libs) and run ./a.out.

I can also see here that with the very short runtime and 128 threads the runtime goes up again. The static overhead with just adding a df.Range(1).<...> in the graph is 1.5s.

I briefly tried the compiled version and it is about 3x faster using a single core. Scalability is note great, though. I might run more extensive later.

Just a quick question in the meantime: what should I run perf on?

Also, since root-readspeed already shows the scalability issue, maybe the problem rather comes from something that is present there as well?

Typically you can simply run perf record ./a.out or on root-readspeed it’s perf record root-readspeed <args>. Then, it’s best to make a flamegraph to view the output, see the README here: GitHub - brendangregg/FlameGraph: Stack trace visualizer. It’s basically running a few perl scripts on top of the perf.data output from perf record!

And I agree, it might well be that the issue is already hidden in IO. But hopefully perf will show us what happens :slight_smile:

@Axel @eguiraud Is this false sharing? We have quite a lot of LL cache misses with 128 cores. Note that I’ve stopped the program after a while, that’s why we have different total number of cache refs in both tests.

# 128 cores

==188169== I   refs:      11,199,960,504
==188169== I1  misses:         9,965,717
==188169== LLi misses:            98,962
==188169==
==188169== D   refs:       4,126,897,445  (2,899,931,854 rd   + 1,226,965,591 wr)
==188169== D1  misses:        30,592,036  (   21,295,405 rd   +     9,296,631 wr)
==188169== LLd misses:        17,424,461  (    9,567,033 rd   +     7,857,428 wr)
==188169==
==188169== LL refs:           40,557,753  (   31,261,122 rd   +     9,296,631 wr)
==188169== LL misses:         17,523,423  (    9,665,995 rd   +     7,857,428 wr)


# 1 core

==188614== I   refs:      28,111,472,692
==188614== I1  misses:         8,372,508
==188614== LLi misses:           103,708
==188614==
==188614== D   refs:      13,466,247,658  (9,371,085,644 rd   + 4,095,162,014 wr)
==188614== D1  misses:        26,169,716  (   18,815,311 rd   +     7,354,405 wr)
==188614== LLd misses:         1,429,714  (      575,651 rd   +       854,063 wr)
==188614==
==188614== LL refs:           34,542,224  (   27,187,819 rd   +     7,354,405 wr)
==188614== LL misses:          1,533,422  (      679,359 rd   +       854,063 wr)

Here the benchmark code:

#include "ROOT/RDataFrame.hxx"
#include "TCanvas.h"

void benchmark1(const std::string input = "Run2012B_SingleMu.root") {
    ROOT::EnableImplicitMT(1);

    ROOT::RDataFrame df("Events", input);
    auto h = df.Histo1D<float>({"", ";MET (GeV);N_{Events}", 100, 0, 2000}, "MET_pt");

    TCanvas c;
    h->Draw();
    c.SaveAs("benchmark1.root");
}

int main() {
    benchmark1();
}

I have managed to produce flame graphs for root-readspeed using perf. Here is the graph for 8 cores (same call as earlier):

Here is the graph for 48 cores:

The big difference seems to be the futex syscalls (from two different locations). Unfortunately, the exact locations are not known. I have compiled root-readspeed with debug symbols, but probably the ROOT installation in the official docker image does not have debug symbols and that’s why this information is missing. Are these graphs useful already or do you need the full call stack?

Hm, the sys_futex thingy speaks for lock contention, right? Let me pull in the experts :wink: @Axel @pcanal @eguiraud

Two small updates: I have tried using more files with root-readspeed in order to overcome the potential problem of “too little data”. In addition, I also put the data on a ram disk in order to eliminate any I/O as the bottleneck (even though this didn’t seem likely given the observations above). Neither of the two changed the numbers even a bit…