Yet another small update: the docker image seems to come with debug symbols (all non-system libraries that the root-readspeed I have compiled use are “not stripped”), so I don’t really know how to get more informative flame graphs.
The scaling of RDataFrame at high core count (more than 32 cores) was improved significantly in the last few weeks. Those changes have not been back ported to v6.22 (and even if they did you would need the not yet released v6.22/10).
So to avoid “seeing” already reduced contention, can you try with the tip of the main branch or the tip of the v6-24-00-patches branches (i.e. the soon to be release v6.24/00)?
In order to be able to address effectively the remaining issue, we would actually need the same type of result you provided but with full debug symbols 
Cheers,
Philippe.
The code in those benchmarks is also not optimized for performance but rather readability (note to @swunsch : there is a lot of jitting and interpreted macros in that repo. Given that people use it to get a measure of RDF performance, we should probably revise that code).
The original intent of those repos was to make code that was a good example - some optimal balance between readability and performance. If there is a real trade-off between readability and performance, then I’d say it would be good to have two examples. The original intent was certainly not to get every last drop of performance out of the code. The hope is that people can look at these and get good ideas of how the tools work and how they compare to each other when trying to perform similar actions.
Indeed, I already forgot about this @ingomueller.net See here for more information: https://indico.cern.ch/e/PPP97
I’ve rerun the benchmark1.C example, fully compiled with 6.22 vs master and 128 threads:
$ # ROOT 6.22
$ source /cvmfs/sft.cern.ch/lcg/views/LCG_99/x86_64-centos7-clang10-opt/setup.sh
$  g++ -O3 benchmark1.cxx $(root-config --cflags --libs)
$ /usr/bin/time ./a.out
16.04user 12.09system 0:13.02elapsed 215%CPU (0avgtext+0avgdata 1029172maxresident)k

$ # ROOT master
$ source /cvmfs/sft-nightlies.cern.ch/lcg/views/dev3/latest/x86_64-centos7-clang10-dbg/setup.sh
$ g++ -O3 benchmark1.cxx $(root-config --cflags --libs)
$ /usr/bin/time ./a.out
53.64user 7.28system 0:03.23elapsed 1885%CPU (0avgtext+0avgdata 1057768maxresident)k
The runtime goes down from 13s to 3s, so indeed, the lock contention is much better now! (To be proven with another flamegraph  )
)
Hi,
some comments/clarifications:
- the fact that
root-readspeedalready has scaling issues indeed indicates that the bottleneck is somewhere in ROOT I/O rather than RDataFrame:root-readspeeddoes not use RDataFrame under the hood - I am pretty sure that our Docker images have ROOT installations without debug symbols. The binaries are not stripped, but there were no debug symbols to strip in the first place (e.g. try compiling a dummy program with
gcc foo.cpp– no debug symbols, butfile a.outstill says “not stripped”. If you compile instead withgcc -g foo.cpp, theninfo a.outsays “with debug_info” and “not stripped”) - thanks to this latest test by @swunsch , ti would seem that the lock contention issues in ROOT I/O that were recently fixed (as @pcanal mentioned) are at least partially responsible for the problematic scaling behavior you see: please try again with a nightly build. If that’s not an option, we can easily provide a Dockerfile to make an image with a nightly build (basically you need this Dockerfile with a different binary)
- @gwatts you are absolutely correct that those benchmarks are supposed to hit a sweet spot between usability and performance. And I also agree that we should add a version that shows how to squeeze the last drop of performance so that expert users can get implementation ideas about that too. In any case @ingomueller.net is absolutely right when he says that slower single-core performance does not imply worse scaling (rather the opposite, very often) – the tricky part here is that the few seconds spent just-in-time compiling some helper code make scaling worse because they add a constant offset to the total runtime. The section “Performance profiling of applications” in the RDF user guide shows how to activate verbose logging so that RDF provides separate timings for the jitting and the actual event loop
Cheers,
Enrico
@eguiraud: Thanks a lot for the clarifications. I just managed to produce a Docker image with ROOT compiled from source, so I should be able to get a version with debug symbols if needed.
In particular, I reran my test from before on v6-24-00-branches (46401b9). This time, I am using taskset to use the first n cores for the n threads to avoid NUMA effects where possible, and I am using it to weak scaling, i.e, I use the same file n times for n threads, to avoid having too little data. The result is this:
for t in 1 2 4 8 16 24 48; do echo "Threads:                        $t"; taskset -c 0-$(($t-1)) ./src/root-readspeed --trees Events --files $(for i in $(seq 1 $t); do echo /data/Run2012B_SingleMu_65536000.root; done) --branches nMuon Muon_pt Muon_eta Muon_phi Muon_mass Muon_charge MET_pt --threads $t; echo; done
Threads:                        1
Real time to setup MT run:      0.086581 s
CPU time to setup MT run:       0.09 s
Real time:                      18.6727 s
CPU time:                       18.67 s
Uncompressed data read:         1916353044 bytes
Throughput:                     97.8743 MB/s

Threads:                        2
Real time to setup MT run:      0.0959201 s
CPU time to setup MT run:       0.1 s
Real time:                      19.5363 s
CPU time:                       39.07 s
Uncompressed data read:         3832706088 bytes
Throughput:                     187.095 MB/s

Threads:                        4
Real time to setup MT run:      0.112656 s
CPU time to setup MT run:       0.11 s
Real time:                      22.253 s
CPU time:                       88.77 s
Uncompressed data read:         7665412176 bytes
Throughput:                     328.509 MB/s

Threads:                        8
Real time to setup MT run:      0.146229 s
CPU time to setup MT run:       0.15 s
Real time:                      24.2602 s
CPU time:                       190.5 s
Uncompressed data read:         15330824352 bytes
Throughput:                     602.658 MB/s

Threads:                        16
Real time to setup MT run:      0.210947 s
CPU time to setup MT run:       0.21 s
Real time:                      28.2824 s
CPU time:                       419.79 s
Uncompressed data read:         30661648704 bytes
Throughput:                     1033.9 MB/s

Threads:                        24
Real time to setup MT run:      0.276222 s
CPU time to setup MT run:       0.28 s
Real time:                      40.0161 s
CPU time:                       713.46 s
Uncompressed data read:         45992473056 bytes
Throughput:                     1096.1 MB/s

Threads:                        48
Real time to setup MT run:      0.469876 s
CPU time to setup MT run:       0.47 s
Real time:                      103.944 s
CPU time:                       1740.8 s
Uncompressed data read:         91984946112 bytes
Throughput:                     843.955 MB/s
In short, it scales pretty well until 16 cores, after which point performance does not improve anymore (but also doesn’t get much worse). This is much better than before but still not ideal. (As measured with dd, the disks/OS cache can actually sustain around 6GB/s, so that shouldn’t be the limit yet.)
I’ll try to rerun the initial queries as well and take a look at RDF verbose logging.
Do you have the flame graph for this new runs?
@pcanal Yes, here they are. 8 cores:
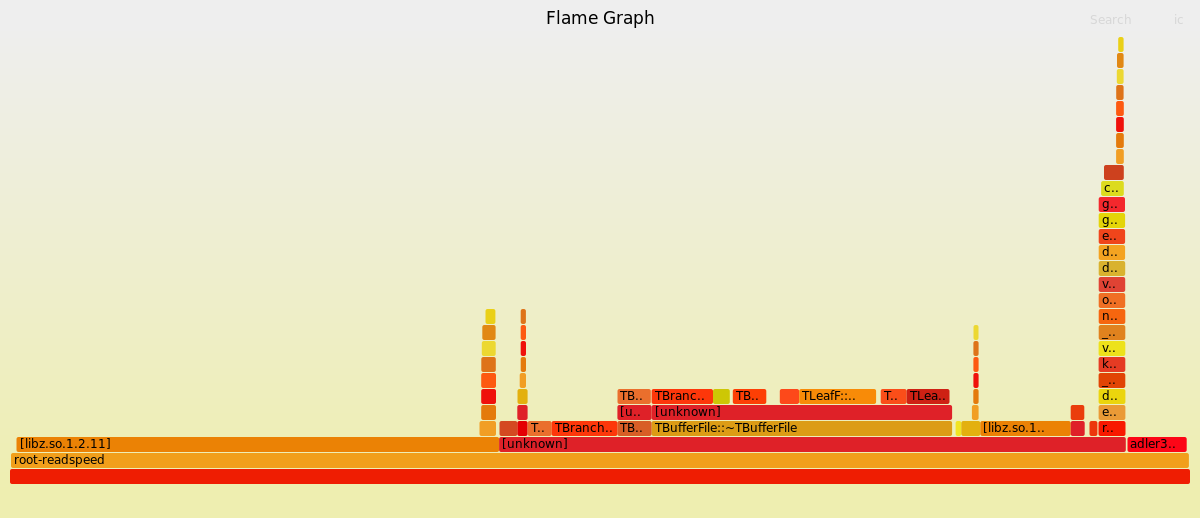
48 cores:
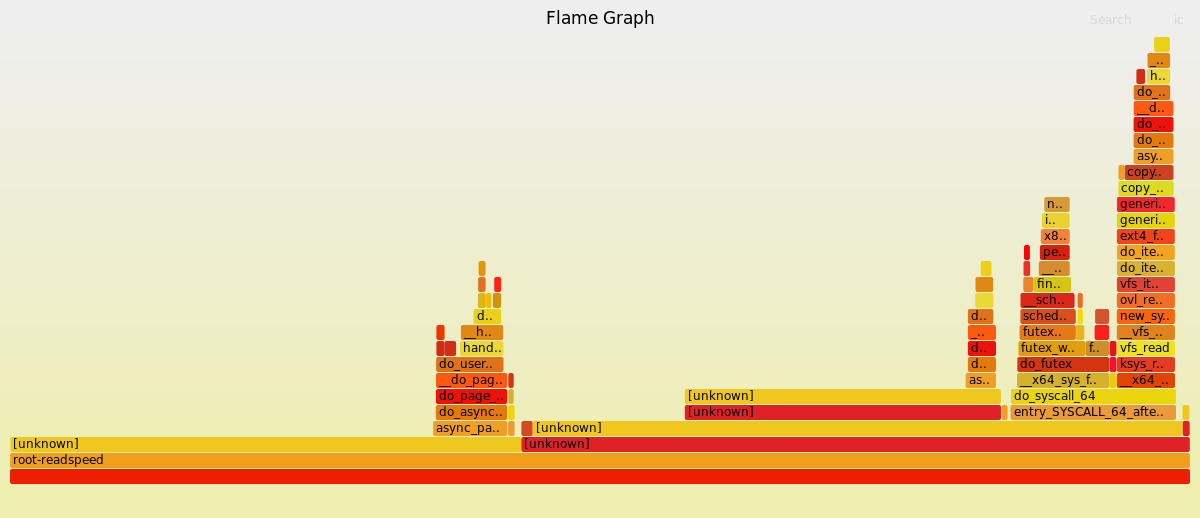
The first one shows most symbols; curiously the second one does not. I can’t make much out of them… less time seems to be spent in futex calls, but the bulk of the time is spent in “unknown”. Any guesses or suggestions what I can do to get more symbols? (I have compiled both ROOT and root-readspeed with -DCMAKE_BUILD_TYPE=RelWithDebInfo.)
(I had them ready yesterday, but I wasn’t allowed to make more than 16 posts on my first day in the forum  )
)
For the unknown symbols, did you buidl readspeed itself with debug symbols?
As I said, I have compiled both ROOT and root-readspeed with -DCMAKE_BUILD_TYPE=RelWithDebInfo. That should include debug symbols, no? Using -DCMAKE_BUILD_TYPE=Debug does not seem wise as this would probably change the performance characteristics significantly. What compilation options do you recommend?
It should but something is swallowing the symbols name right under the main of root-readspeed, so it is plausible that the different is there. Do you have the compile lines for root-readspeed? (i.e. make/ninja verbose output)
I’ll have updates on the compile options in a bit, but some interesting new insights in the meantime. I just ran n identical single-threaded instances of root-readspeed for various n (and otherwise unchanged to above) like so:
for t in 1 2 4 8 16 24 48; do
    echo "Threads: $t"
    for i in $(seq 1 $t); do
        taskset -c $(($i-1)) ./src/root-readspeed --trees Events --files /data/Run2012B_SingleMu_65536000.root \
            --branches nMuon Muon_pt Muon_eta Muon_phi Muon_mass Muon_charge MET_pt \
            --threads 1 | tee root-readspeed-$t-$i.log | grep Throughput &
    done
    wait
    echo
done
This is the result:
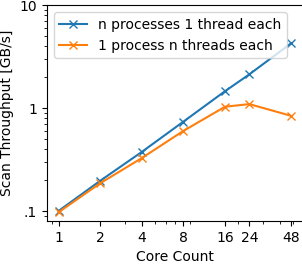
The separate processes scale essentially linearly; looking at the numbers, I see that 48 cores reach 88% of the ideal throughput based on the single-process single-thread throughput. With 48 cores, the systems sustains about 4GB/s. The normal way of using root-readspeed, i.e., a single process with multiple threads, maxes out at 1.1GB/s with 16 cores and is slightly slower with 48.
For me, this clearly shows that there is a scalability problem inside the root-readspeed process including the libraries it uses (and not the OS or the hardware).
As promised, I checked that cmake compiles the program as it should:
$ cmake .. -DCMAKE_BUILD_TYPE=RelWithDebInfo
-- The CXX compiler identification is GNU 9.3.0
...
[ 50%] Building CXX object src/CMakeFiles/root-readspeed.dir/root_readspeed.cxx.o
cd /root/root-readspeed/build/src && /usr/bin/c++  -DVECCORE_ENABLE_VC -isystem /opt/root/include  -O2 -g -DNDEBUG   -Wall -Wextra -Wpedantic -o CMakeFiles/root-readspeed.dir/root_readspeed.cxx.o -c /root/root-readspeed/src/root_readspeed.cxx
[100%] Linking CXX executable root-readspeed
cd /root/root-readspeed/build/src && /usr/bin/cmake -E cmake_link_script CMakeFiles/root-readspeed.dir/link.txt --verbose=1
/usr/bin/c++  -O2 -g -DNDEBUG   CMakeFiles/root-readspeed.dir/root_readspeed.cxx.o  -o root-readspeed  -Wl,-rpath,/opt/root/lib /opt/root/lib/libTreePlayer.so.6.22.08 /opt/root/lib/libTree.so.6.22.08 /opt/root/lib/libGraf3d.so.6.22.08 /opt/root/lib/libGpad.so.6.22.08 /opt/root/lib/libGraf.so.6.22.08 /opt/root/lib/libHist.so.6.22.08 /opt/root/lib/libMatrix.so.6.22.08 /opt/root/lib/libMathCore.so.6.22.08 /opt/root/lib/libImt.so.6.22.08 /opt/root/lib/libMultiProc.so.6.22.08 /opt/root/lib/libNet.so.6.22.08 /opt/root/lib/libRIO.so.6.22.08 /opt/root/lib/libThread.so.6.22.08 /opt/root/lib/libCore.so.6.22.08 -lpthread
Unfortunately, this did not really help. I also added -DCMAKE_CXX_FLAGS=-fno-omit-frame-pointer when compiling both ROOT and root-readspeed with no luck.
Then I made an weird oberservation: the very first run had actually worked. This must have been the case yesterday as well, which is why the flame graph of the 8-core configuration has symbols. By chance, I got the 48-core configuration today:
Given the perspective to fight some non-reproducible behavior of my system, I am not very motivated to spend much more time on the flame graphs to be honest. If I can provide more information on exactly what I have run for you to reproduce it, I’d be happy to do that. (But I guess @swunsch already managed yesterday…)
Just to close this line of the discussion, I ran the queries with logging enabled (on the nightlies). This is the result:
Query 1: Just-in-time compilation phase completed in 0.687930 seconds.
Query 2: Just-in-time compilation phase completed in 0.820865 seconds.
Query 3: Just-in-time compilation phase completed in 0.945058 seconds.
Query 4: Just-in-time compilation phase completed in 0.976360 seconds.
Query 5: Just-in-time compilation phase completed in 0.960116 seconds.
Query 6: Just-in-time compilation phase completed in 2.098718 seconds.
Query 7: Just-in-time compilation phase completed in 1.199311 seconds.
Query 8: Just-in-time compilation phase completed in 2.160178 seconds.
The numbers are on the full 53M-event data set, but I got very similar numbers for the small subsets (which is expected). This is in line with my observation that queries terminate in at most about 2s when run on a tiny sub set. For me, this shows that the jitting cannot explain the problematic behavior.
Hi @ingomueller.net ,
thanks for the thorough investigation, much appreciated.
Indeed all evidence points to a scaling issue in root-readspeed or ROOT I/O (root-readspeed just calls TBranch::GetEntry for the desired branches, for different clusters in different threads). Jitting is indeed excluded as a culprit by the fact that root-readspeed (which does not jit anything) does not scale well either.
Can you please share the full svg file of the 48-core flamegraph (the PNG is not as “explorable”)? (very weird that you only get all symbols on the first run by the way, I have never seen that before).
One last thing, then the ball is 100% in our court: what’s the scaling of RDF (not root-readspeed) like with ROOT v6.24? It should be better than what you saw with v6.22, is this the case?
Cheers,
Enrico
I just ran the queries again using yesterday’s version of v6-24-00-patches. Surprisingly, the performance is pretty much exactly the same as in my initial post:
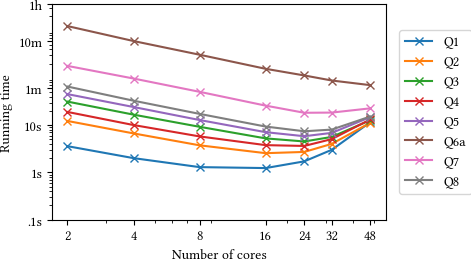
In particular, I have compared the raw numbers for 48 cores: they seem to vary only by noise; no trend (or the improvement we hoped for) is visible.
I have discarded the perf results and SVGs but I’ll run them again in the next few days.
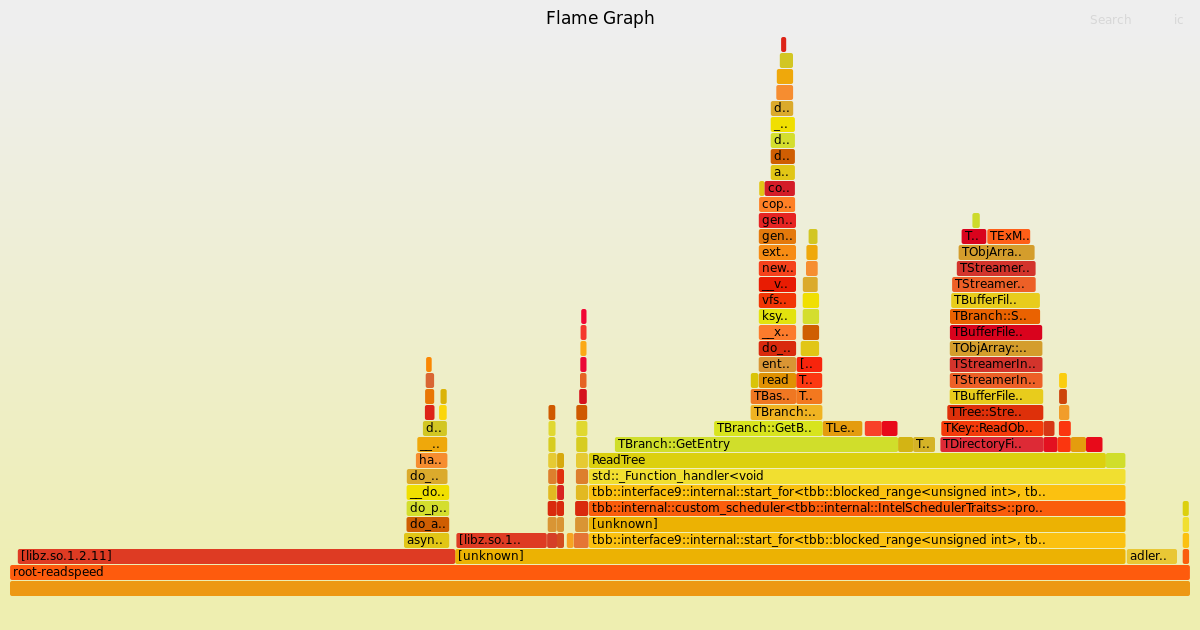
I have just rerun the single-process experiments with root-readspeed to get proper flamegraphs. I used a fresh docker container every run to resolve the weird problems with the symbols and I think that was a least partially successful. This attachement (44.2 KB) contains the SVG files and the outputs of stackcollapes-perf.pl. I have also uploaded the raw trace files of perf here.
Can reproduce with ROOT@master built as RelWithDebInfo and root-readspeed on a new 64-core machine with data on a fast local SSD:
Throughput 1 thread:                       91.2035 MB/s
Throughput 2 threads:                     179.148  MB/s
Throughput 4 threads:                     353.084  MB/s
Throughput 8 threads:                     647.197  MB/s
Throughput 16 threads:                   1167.26   MB/s
Throughput 32 threads:                   1231.19   MB/s
Throughput 64 threads:                   1005.86   MB/s
Investigation in progress.
Hi,
just a quick update: more investigation is needed but the lack of scaling seems to be due to how short-lived the tasks are in this artificial benchmark. Somehow this causes the TBB task scheduler (which ROOT uses internally for task-based parallelism) to distribute work very poorly. This is the CPU usage for the usual root-readspeed invocation with increasing number of threads:
thread CPU%
1 99%
2 195%
4 377%
8 721%
16 1305%
32 1662%
48 1656%
64 1770%
Artificially increasing the per-event workload seems to help, as well as merging multiple tasks together into larger tasks (@pcanal tried decreasing values of TTreeProcessorMT::SetMaxTasksPerWorkerHint, which indirectly increase the size of each task) which tells me you probably won’t see this issue with a realistic workload (as is also our experience with other real analyses).
The behavior is still to be better understood, in particular to figure out whether we can tune things better out of the box even for workloads such as this one.
Cheers,
Enrico
@eguiraud, thanks a lot for the update! I am glad that you can reproduce the problem; however, I don’t really buy the explanation that the query does “too little work.” If only very compute-heavy queries can run at full speed, then this means that the system is effectively I/O bound (with a bound that is much worse than the hardware would allow).
Also, remember that we first noticed the problem with “real” queries, not with root-readspeed. (If you consider the queries in the benchmark as unrealistic, it would be great to hear why such that the benchmark can be improved/extended.)