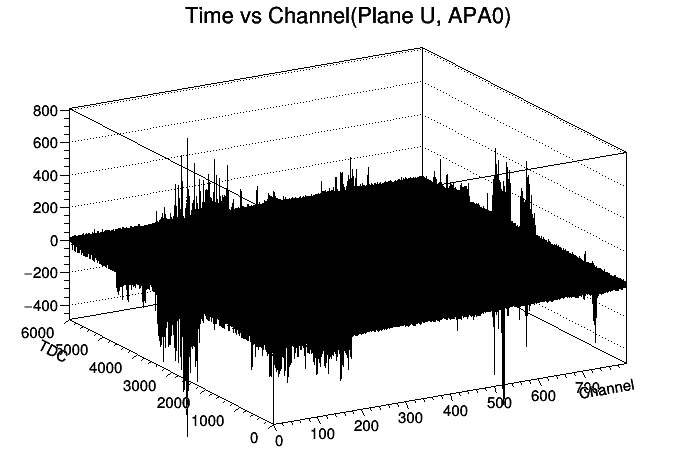
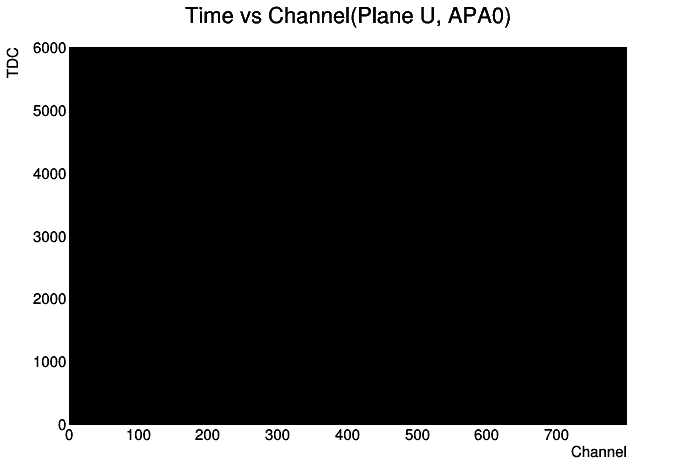
Saving histogram to file (png/pdf/svg) is very slow


_ROOT Version:_6.13/08
_Platform:_Ubuntu 16.04
_Compiler:_gcc-5.5.0


Hello,

I have a ROOT file containing a TDirectoryFile of 18 histograms (TH2S). I want to draw a single one of them on a TCanvas and then save this as an image to file. I have the following code:

#include "TROOT.h"
#include "TFile.h"
#include "TDirectory.h"
#include "TH2S.h"
#include "TCanvas.h"

int main() {
  gROOT->SetBatch(1);

  TFile *f = new TFile("raweventdisplay.root");
  TDirectory *d = f->GetDirectory("rawdraw");
  TH2S *hist = nullptr;
  d->GetObject("fTimeChanU0", hist);

  TCanvas *c = new TCanvas();
  hist->Draw();
  c->Print("hist.png");

  return 0;
}

It takes 8m11s to execute (compiled, not interpreted) this code on my laptop (Intel Core i7), which seems quite long, considering that the histogram I am trying to draw has {800, 6000, 1} bins (which I found through GetNBins[X,Y,Z]). I takes about 15 minutes on a POWER8 (remote) machine.

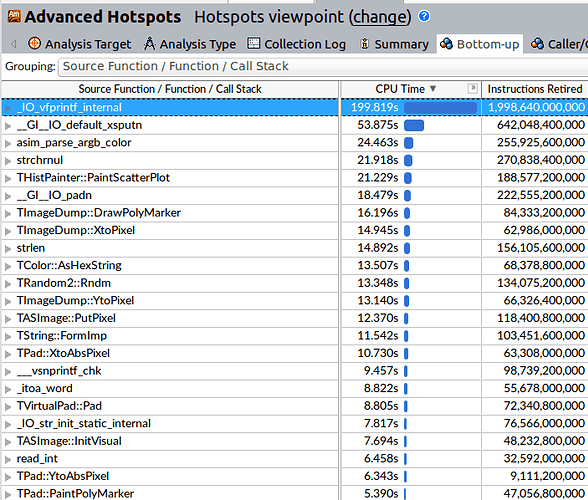
I profiled this code (on my laptop) with Intel VTune to find the following:

The vfprintf seem to be originating mostly from this callstack:

#0  0x00003fffb5876540 in _IO_default_xsputn () from /opt/at12.0/lib64/power8/libc.so.6
#1  0x00003fffb584130c in vfprintf () from /opt/at12.0/lib64/power8/libc.so.6
#2  0x00003fffb586e434 in vsnprintf () from /opt/at12.0/lib64/power8/libc.so.6
#3  0x00003fffb7c7709c in TString::FormImp (this=0x3fffb7f5f270 <TColor::AsHexString() const::tempbuf>, fmt=<optimized out>, ap=<optimized out>)
    at /afs/cern.ch/user/a/ahhesam/root/core/base/src/TString.cxx:2228
#4  0x00003fffb7c77184 in TString::Form (this=<optimized out>, fmt=<optimized out>) at /afs/cern.ch/user/a/ahhesam/root/core/base/src/TString.cxx:2268
#5  0x00003fffb7c068c8 in TColor::AsHexString (this=0x10079e10) at /afs/cern.ch/user/a/ahhesam/root/core/base/src/TColor.cxx:1216
#6  0x00003fffb63cbba4 in TImageDump::DrawPolyMarker (this=0x11ce00f0, n=<optimized out>, xw=0x11d61d50, yw=0x11d7f110)
    at /afs/cern.ch/user/a/ahhesam/root/graf2d/postscript/src/TImageDump.cxx:339
#7  0x00003fffb6b4136c in TPad::PaintPolyMarker (this=0x115ebfa0, nn=<optimized out>, x=0x11d61d50, y=0x11d7f110)
    at /afs/cern.ch/user/a/ahhesam/root/graf2d/gpad/src/TPad.cxx:4382
#8  0x00003fffa7c26140 in THistPainter::PaintScatterPlot (this=0x11d48d30, option=<optimized out>)
    at /afs/cern.ch/user/a/ahhesam/root/hist/histpainter/src/THistPainter.cxx:8049
#9  0x00003fffa7c198a4 in THistPainter::PaintTable (this=0x11d48d30, option=0x11b4bba1 "")
    at /afs/cern.ch/user/a/ahhesam/root/hist/histpainter/src/THistPainter.cxx:9192
#10 0x00003fffa7bfa3f0 in THistPainter::Paint (this=0x11d48d30, option=0x11b4bba1 "")
    at /afs/cern.ch/user/a/ahhesam/root/hist/histpainter/src/THistPainter.cxx:4172
#11 0x00003fffb7161744 in TH1::Paint (this=0x11b4b820, option=0x11bf4d59 "") at /afs/cern.ch/user/a/ahhesam/root/hist/hist/src/TH1.cxx:5700
#12 0x00003fffb6b55248 in TPad::Paint (this=0x115ebfa0) at /afs/cern.ch/user/a/ahhesam/root/graf2d/gpad/src/TPad.cxx:3432
#13 0x00003fffb6aff6d4 in TCanvas::Paint (this=<optimized out>, option=<optimized out>)
    at /afs/cern.ch/user/a/ahhesam/root/graf2d/gpad/src/TCanvas.cxx:1473
#14 0x00003fffb6b5073c in TPad::Print (this=0x115ebfa0, filenam=<optimized out>, option=<optimized out>)
    at /afs/cern.ch/user/a/ahhesam/root/graf2d/gpad/src/TPad.cxx:5069
#15 0x00003fffb6b51d68 in TPad::SaveAs (this=0x115ebfa0, filename=<optimized out>) at /afs/cern.ch/user/a/ahhesam/root/graf2d/gpad/src/TPad.cxx:5551
#16 0x00003fffb6b24d30 in TPad::Print (this=<optimized out>, filename=<optimized out>) at /afs/cern.ch/user/a/ahhesam/root/graf2d/gpad/src/TPad.cxx:4619
#17 0x0000000010000ec8 in main ()

Am I doing something in a non-optimal way, or is this how long it should take to export a single histogram to file?

Best,
Ahmad

Edit: the root file can be found here: https://cernbox.cern.ch/index.php/s/rtURqNAIpDgGUXY
Hi,
I don’t think the problem is in the code reading and drawing the histos. Even when opening your root file interactively (e.g. with TBrowser), drawing took me a long time too. But try with some of the drawing options; for instance:

hist->Draw("colz");

or “surf”; in my case, both sped up drawing a lot in the root prompt; I did not try compiling, but it should be the same.
https://root.cern.ch/doc/v608/classTHistPainter.html#HP01c
As for why it takes so long, it could just be because of the large number of bins, or maybe there is some issue with the binning in the saved histograms, but I don’t really know, maybe an expert can provide more insight.

Try the fast col option “col2”

Wow thanks @dastudillo: that brought the runtime down to just 3 seconds, and with an output that I actually expect (rather than the fully black canvas I got before).

@couet, I also tried "col2", but that gives me an empty canvas.

I also played around with ff in "scat=ff", as demonstrated in the documentation, which is documented as “a scale factor to compute the number of dots”. I found the following:

ff=1e-1 results in in a black-and-white surface plot (rather than a scatter plot), and looks similar to "surf" (took 7 seconds)
ff=0.1 results in a black (really dense) scatter plot (takes 49 seconds)
ff=0.005 results in a scatter plot that shows the same level of detail as "col" (took 5 seconds)

It’s unexpected that setting ff=0.1 gives another type of plot than setting ff=1e-1

Can you provide a small example reproducing the problem ?

Well the reproducer would be essentially the code I provided in the opening post, but then drawing the canvas with different parameters for ff.

#include "TROOT.h"
#include "TFile.h"
#include "TDirectory.h"
#include "TH2S.h"
#include "TCanvas.h"

int main() {
  gROOT->SetBatch(1);

  TFile *f = new TFile("raweventdisplay.root");
  TDirectory *d = f->GetDirectory("rawdraw");
  TH2S *hist = nullptr;
  d->GetObject("fTimeChanU0", hist);

  TCanvas *c1 = new TCanvas();
  hist->Draw("scat=0.1");
  c1->Print("hist_0.1.png");

  TCanvas *c2 = new TCanvas();
  hist->Draw("scat=e-1");
  c2->Print("hist_e-1.png");

  return 0;
}

hist_e-1.png and hist_0.1.png are two different outputs, respectively:

Here an reproducer based on one of your examples @couet:

// Example displaying a 2D histogram with its two projections.
// Author: Olivier Couet
{
   TCanvas *c1 = new TCanvas("c1", "c1",900,900);
   gStyle->SetOptStat(0);

   // Create the three pads
   TPad *top_pad = new TPad("top_pad", "top_pad",0.0,0.55,0.6,1.0);
   top_pad->Draw();

   right_pad = new TPad("right_pad", "right_pad",0.55,0.0,1.0,0.6);
   right_pad->Draw();

   // Create, fill and project a 2D histogram.
   TH2F *h2 = new TH2F("h2","",40,-4,4,40,-20,20);
   Float_t px, py;
   for (Int_t i = 0; i < 2500000; i++) {
      gRandom->Rannor(px,py);
      h2->Fill(px,5*py);
   }

   // Drawing
   top_pad->cd();
   gStyle->SetPalette(1);
   h2->Draw("scat=0.1");

   right_pad->cd();
   h2->Draw("scat=1e-1");
}

Adapted from: https://root.cern.ch/root/html534/tutorials/hist/h2proj.C.html

I looked at the histogram you uploaded in the "edit"of your first post.
It has 60x6000 bins. That’s why it kales time to Draw. A fast drank option like COL2 would be much faster tan the standard options.

root [0]   TFile *f = new TFile("raweventdisplay.root");
root [1]   TDirectory *d = f->GetDirectory("rawdraw");
root [2]   TH2S *hist = nullptr;
root [3]   d->GetObject("fTimeChanU0", hist);
root [4]   hist->Draw("col2");

Strangely your code works fine in the interpreter, but if I compile it, I get empty canvases using the COL2 option… Any idea why that is?

How did you get that there are 60x6000 bins? If I do hist->GetNbinsX and hist->GetNbinsY(), I get 800 and 6000 respectively (as I mentioned in the first post.

yes sorry … 800x6000 … so even bigger. Which mean that long X you have 10 bins per pixel … plotting as a scatter plot does not make sense.

Compiled mode or interpreted should not make any difference.

This topic was automatically closed 14 days after the last reply. New replies are no longer allowed.