SaveAs("file.pdf") from compiled

Hi, I’m trying to save my histogram from compiled C++ code using the command
hist1->SaveAs(“hist1.pdf”);

It creates a file “hist1.pdf” but it’s actually a plain-text macro for the histogram instead of the pdf.
does the same for .gif and .png or whatever I try to use

anysolutions?

//UPDATED—
I looked into it and it seems I should be using c1->SaveAs(“hist1.pdf”) where c1 is the name of the canvas.
So my question is how do I assign a histogram to a canvas?

That’s very bizarre. Which ROOT version are you using ?
It should work the way you do it. But try: hist1->SaveAs(“hist1.pdf”,“pdf”);

Running version 5.27

Nope, SaveAs(“hist1.pdf”,“pdf”); doesnt work

It’s creating a C++Macro file in place.
Looking closer at the SaveAs it’s typically a function of a canvas.

So maybe my real question is how to I declare a canvas with name c1
and then assign my histogram to that canvas?

In :
hist1->SaveAs(“hist1.pdf”);
was not a canvas ? …
of course it does not work …

you should do:
hist1->Draw();
c1->SaveAs(…

Got it. Works fine from Canvas… however I am having trouble setting styles on the canvas

gStyle->SetCanvasBorderMode(0);
gStyle->SetPadBorderMode(0);
gStyle->SetPadColor(0);
gStyle->SetCanvasColor(0);
gStyle->SetTitleColor(0);
gStyle->SetStatColor(0);
gStyle->SetPadTickX(1);
gStyle->SetPadTickY(1);

gStyle->SetTitleSize(0.05593);
gStyle->SetTitleXOffset(0.95);
gStyle->SetTitleXSize(0.08);
gStyle->SetTitleFont(132,“xyz”);
gStyle->SetLabelFont(132,“xyz”);

gStyle->SetTitleYOffset(1.0);
gStyle->SetTitleYSize(0.06593);
gStyle->SetTitleXSize(0.06593);

gStyle->SetTitleBorderSize(0);
gStyle->SetNdivisions(10,“xyz”);
gStyle->SetLabelSize(0.035,“xyz”);
gStyle->SetOptStat(000000);
gStyle->SetPadBottomMargin(0.15);
gStyle->SetPadLeftMargin(0.15);

included in my c++ code and it’s stil

so ? what is the problem ?

strangely I’m still getting that ugly gray background. I’ve tried other color codes for canvas color and also kWhite kGreen and such… no change.

try

   gStyle->SetCanvasColor(0);
   gStyle->SetFrameBorderMode(0);
   gStyle->SetStatBorderSize(1);
   gStyle->SetFrameFillColor(0);
   gStyle->SetTitleFillColor(0);

no difference.

Can you post simple running macro showing your problem ?

well the macro runs just fine with the script, sorry if I hadn’t been more specific. The problem is that I’m running a compiled C++ script that opens an ntuple and then plots some 4 histograms… which I then need to open up in TBrowser and print each one individually after running the style macro… since I’m still learning root,I’m doing a lot of debugging and it is incredibly time consuming.

So what I did is I put the style macro into my compiled C++ script and have each histogram drawn onto the canvas and saves the canvas with each histogram I’d plot. All the styles are working except for SetCanvasColor

is there some reason this shouldnt work with compiled C++ coding?
analyze.h (2.05 KB)
analyze.cpp (7.65 KB)

So the problem shows when you read back the histograms and display them interactively in ROOT. Have you tried to put the style parameters I sent you in your rootlogon.C file ?

Yes, I was having trouble setting up my rootlogon.C file also. But I just figured that out 20 minutes ago. I’ll probably just use rootlogon.C and a macro to save each histo as an alternative.

Thank you for your help!

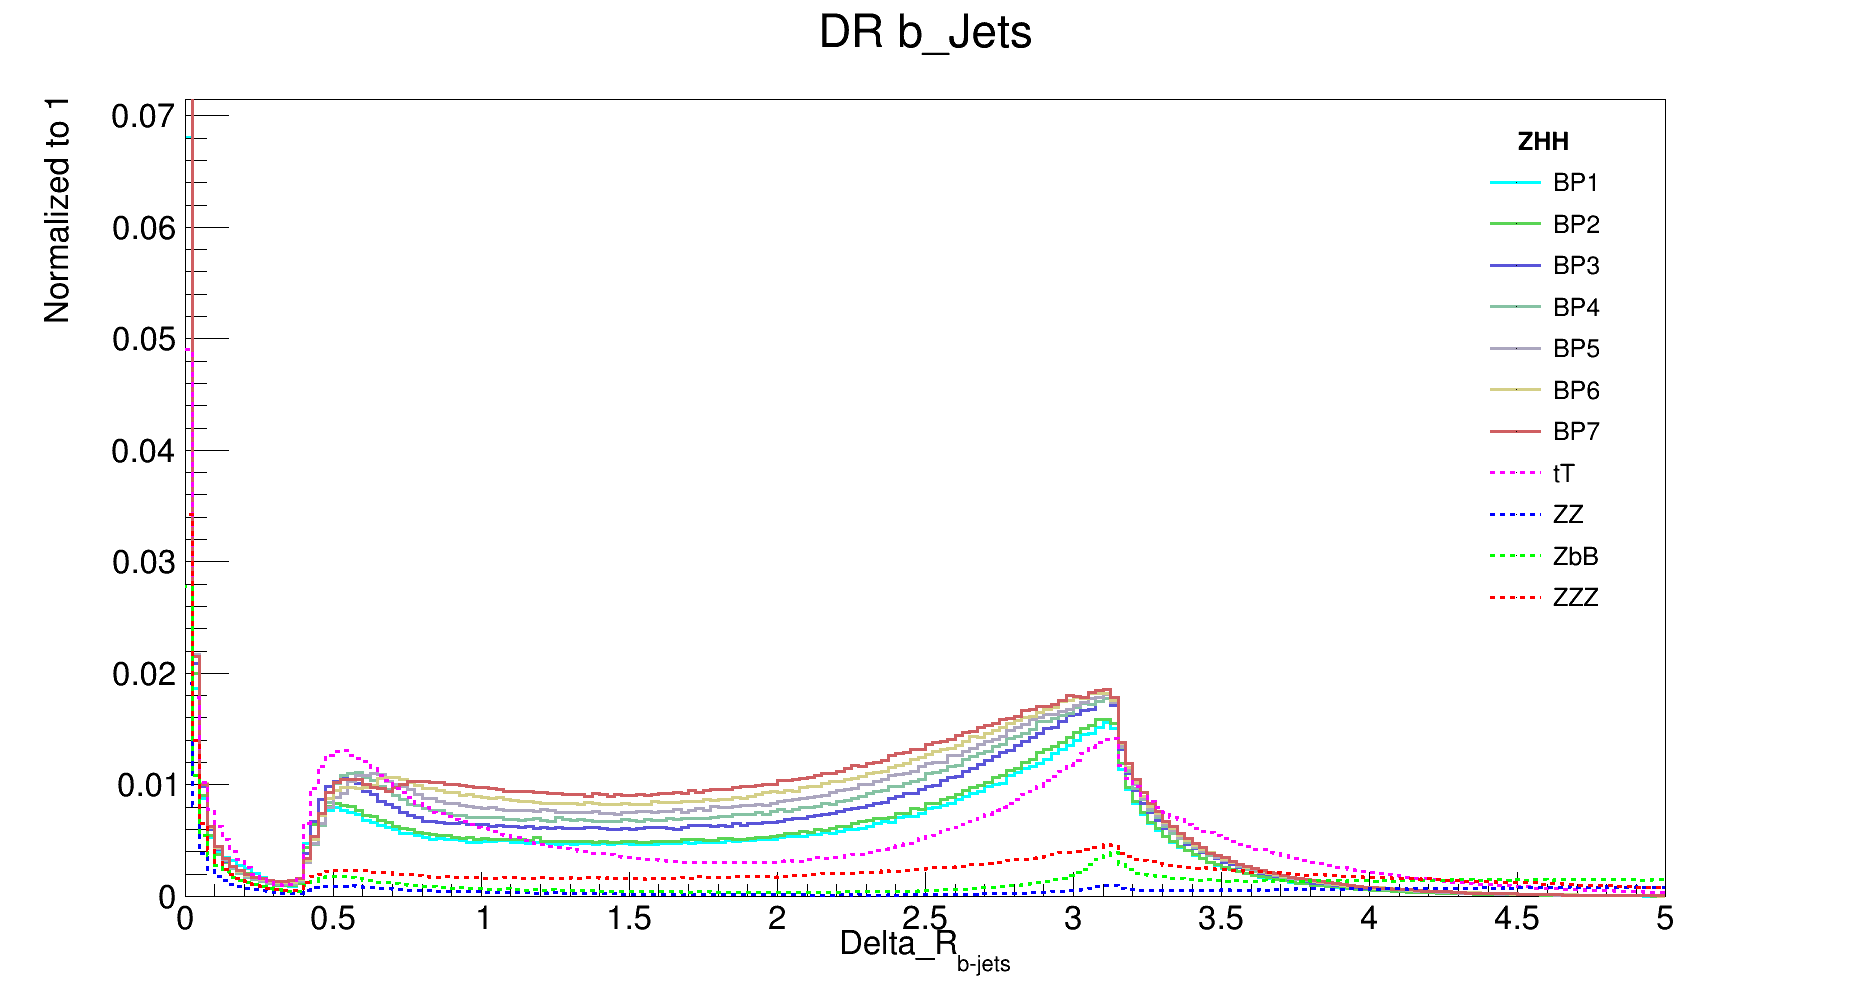
I am also generating histogram and when trying to save as .png and insert it into MS word then after print it became dull. But my friend try it to save as .pdf then convert it into .jpg then it works and picture doen’t become blur. But in my case when I try to save as .pdf then histogram line became too thick and mess up created. Both files are attached. How can we fix??
Also #Delta symbol does not appear in .pdf format.


c1.pdf (30.0 KB)

I see your pdf is a is quite small. Produce it on a larger TCanvas. That will increase the definition.

Larger canvas in sense??

Create a bigger TCanvas. See ROOT: TCanvas Class Reference

Can you suggest me the value of w and h suitable to save as file.pdf in below?

c->SetCanvasSize(w,h);

Have a look at the macro you used to generated this plot. If you do not not have the canvas creation at the beginning add one:

TCanvas *c1 = new TCanvas("c1","c1",1600,1000);

Again lines became bold than original one after saving as .pdf.
c1.pdf (30.0 KB)