Hi Everyone,
I am using the “simple_canvas” code by @bellenot.
Everything works fine until I want to save the content from the canvas to a vector graphic supported file type (e.g. pdf) using the “saveas” command.
The generated pdf file has a white background, which size is changeable with “SetWindowSize()”, but the histogram is missing.
My guess is, that there is a conflict between the TApplication and the QApplication because in the following example the histogram is drawn in the first pdf and not in the second one. Is this a known issue and exists therefor a workaround?
Thanks.
int main(int argc, char *argv[]) {
TApplication *rootapp = new TApplication("Simple Qt ROOT Application", &argc, argv);
TCanvas *canvas = new TCanvas("canvas", "canvas title", 800, 600);
canvas->cd();
TFormula *form1 = new TFormula("form1","abs(sin(x)/x)");
TF1 *sqroot = new TF1("sqroot","x*gaus(0) + [3]*form1", 0, 10);
sqroot->SetParameters(10, 4, 1, 20);
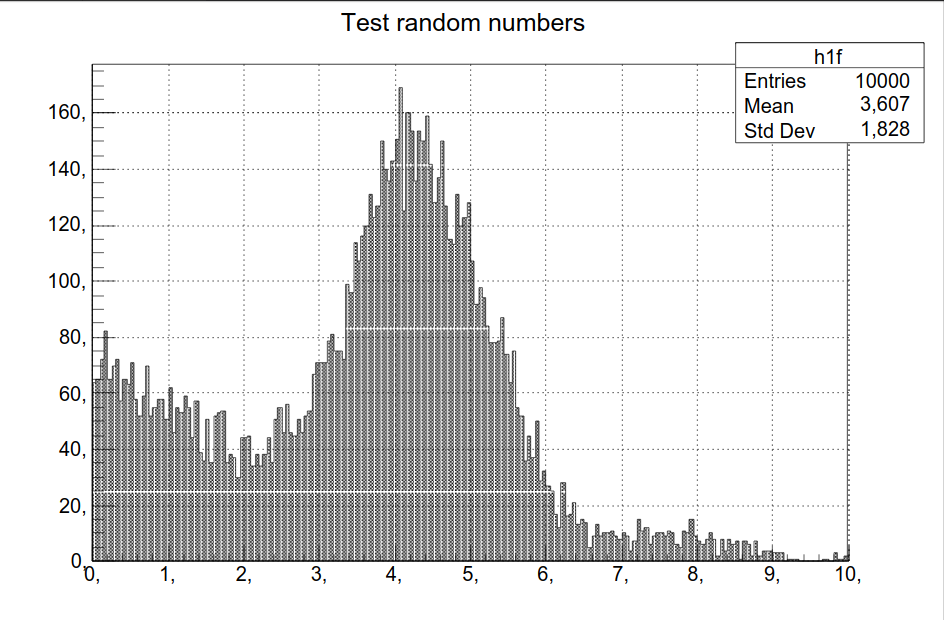
TH1F *hist = new TH1F("h1f","Test random numbers", 200, 0, 10);
hist->FillRandom("sqroot", 100000);
hist->Draw("HIST");
canvas->SaveAs("hist_a.pdf");
QApplication app(argc,argv);
canvas->SaveAs("hist_b.pdf");
QMainCanvas m(0);
m.resize(m.sizeHint());
m.setWindowTitle("Qt Example - Canvas");
m.setGeometry( 100, 100, 699, 499 );
m.show();
m.resize(700, 500);
QObject::connect( qApp, SIGNAL(lastWindowClosed()), qApp, SLOT(quit()) );
return app.exec();
}
ROOT: Version: 6.06.02
Platform: Not Provided
Compiler: Not Provided