I have produced graphs using Python, but I also need to provide .C macros. The graphs I produce have wrong axis ranges after saving them as macros and running them again.
Here is a simple example:
import ROOT

graphs = ROOT.TMultiGraph()
canvas = ROOT.TCanvas("c1", "Graphs", 10,10, 1200,800)

graph = ROOT.TGraph()
graph.SetPoint(0,1,1)
graph.SetPoint(1,2,2)

graphs.Add(graph, "l")
graphs.Draw("A")

graphs.GetXaxis().SetLimits(0, 3)

canvas.Update()
canvas.SaveAs("test_saveas.C")
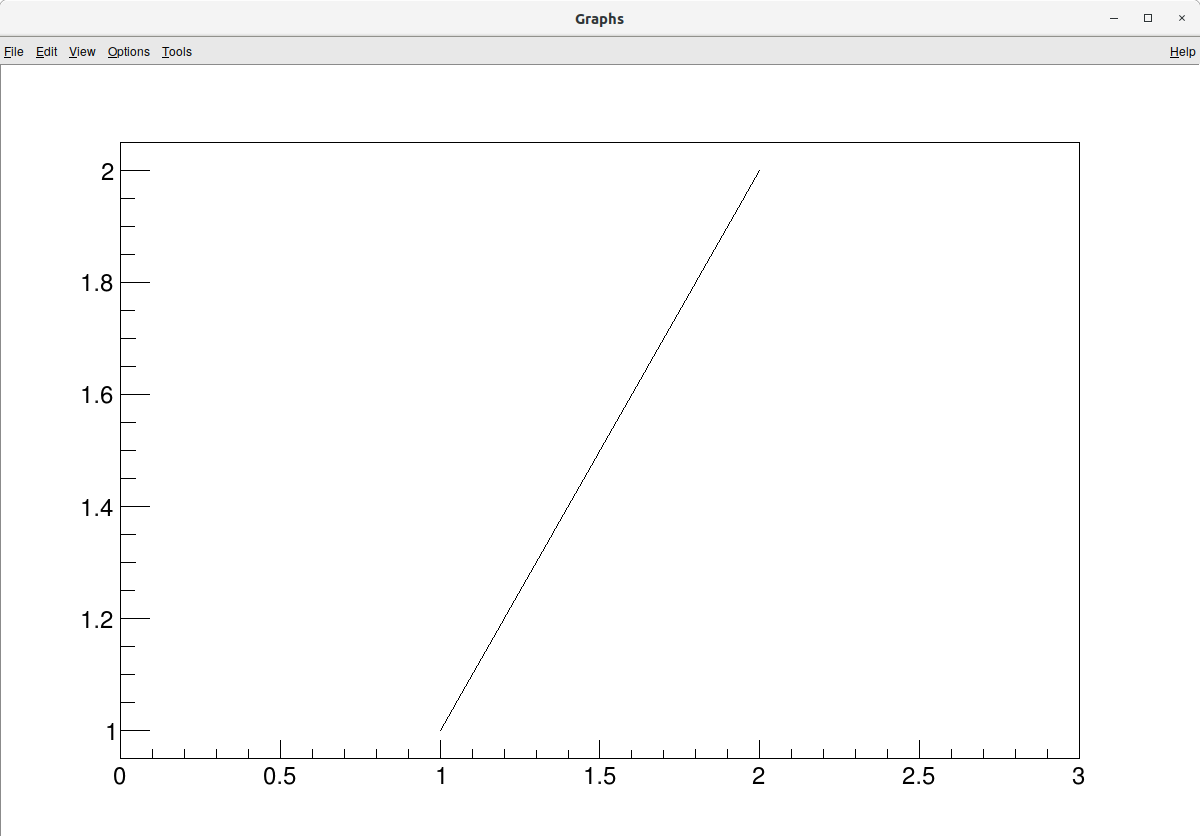
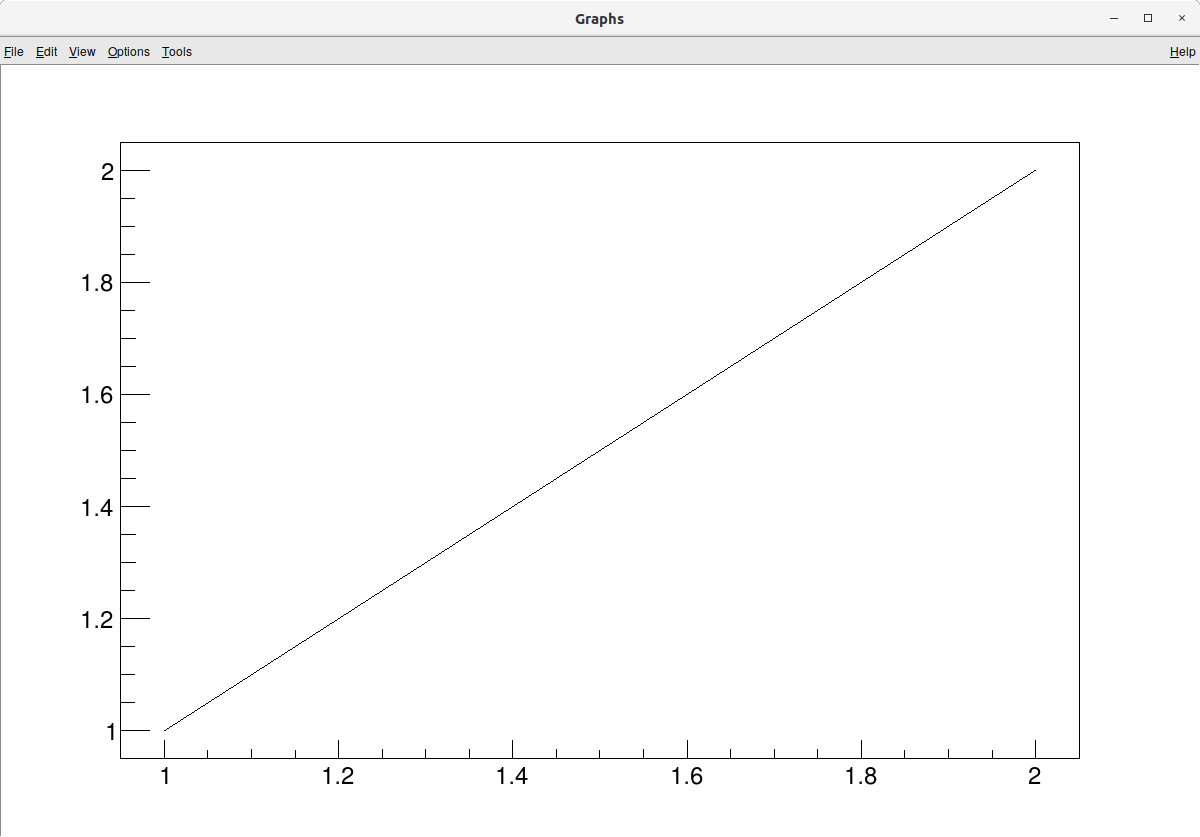
If I run it using python3 -i test_saveas_macro.py, I get the first image below, if I then run root test_saveas.C, I get the second image below. The axis ranges in the second case, for the root macro, are wrong. Is this a bug or do I have to do something different?
ROOT Version: 6.16
Platform: Ubuntu 18.04
Compiler: gcc 7.4
Python: 3.6.8