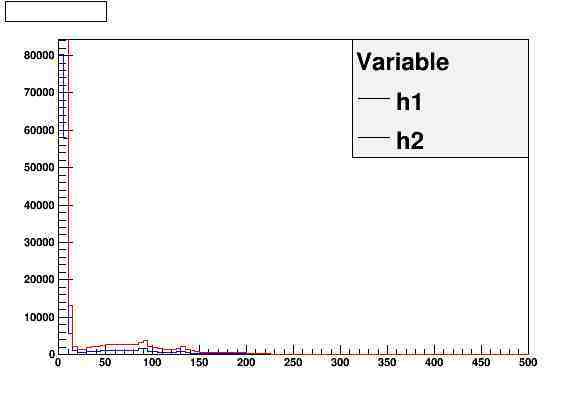
I have a problem when creating a legend. I try to draw in one single canvas different histograms referring to a specific variable, which I take from the subfolders of a root file. The problem is that inside the legend, the lines do not correspond to the histograms they refer to, but are all drawn in black.
How can I fix this?
Thank you.
PS: here I post part of the code I use (is there anything wrong in it?)
void compare ()
{
gROOT->SetStyle(“Plain”) ;
TCanvas *c1 = new TCanvas(“c1”,“Variable”,1) ;
leg = new TLegend(0.6,0.6,0.9,0.9) ;
I think my problem can be solved just by changing the title of each histogram, and then using the command “BuildLegend”. In fact, this works!
However, any other suggestion will be well accepted !
I have a strange problem. I have the following code and as I run the code the legend (whatever the style of the legend is; line or box) in the plot is just black coloured. Black bordered box or black line. But due to the adjustment of histogram colors, the indication for histogram “NLO…” must be blue and the indication for histogram “LO…” must be red in the Legend. I actually could not find where is the problem . Doess anybody have a suggestion on top of this problem? Thanks in advance!