Root Fit (3 Gaussians on an Exponential Background)

Hi,
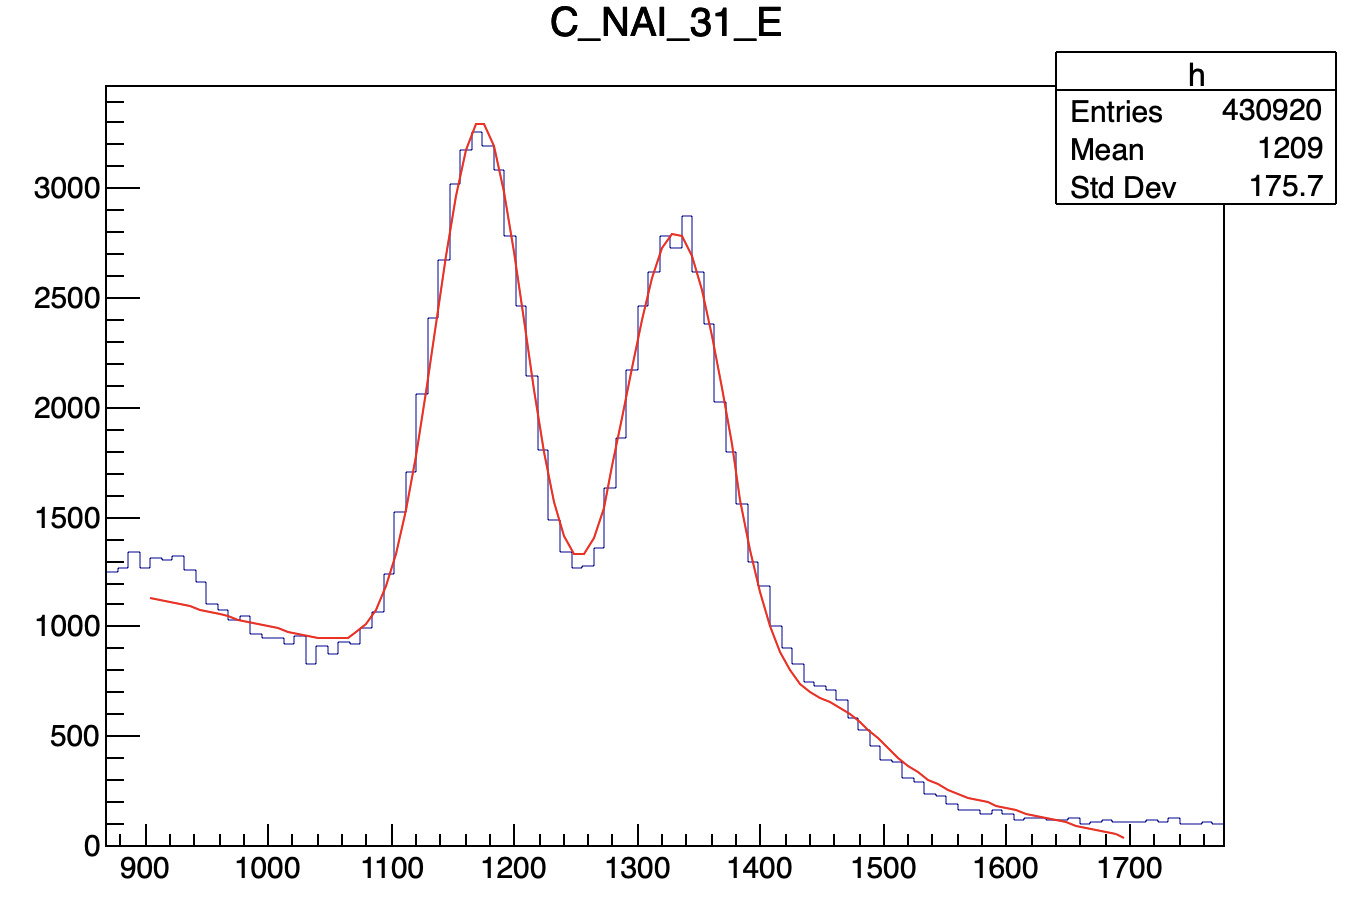
Could anyone comment on the following problem. I fit three gaussians and an exponential background to a dataset (see attached diagram). The drawn fit looks good, but the parameters do not make sense (negative Sigma, params 6 and 8). Also if you take the integral of one of the gaussian peaks the number is very large, coming close to the actual number of entries for the whole tree. For example the integral of the first peak is ~277000, but the number of entries in the tree is only 430920. Perhaps I am not understanding something. Can anyone explain this?

Using Root v5.12 on Linux (Ubuntu)

Fit Parameters are :

FCN=151.23 FROM MIGRAD STATUS=CONVERGED 1154 CALLS 1155 TOTAL
EDM=1.72682e-07 STRATEGY= 1 ERROR MATRIX UNCERTAINTY 1.6 per cent
EXT PARAMETER STEP FIRST
NO. NAME VALUE ERROR SIZE DERIVATIVE
1 p0 2.70685e+03 2.27274e+01 4.79690e-02 2.76691e-05
2 p1 1.17300e+03 fixed
3 p2 4.06125e+01 3.48999e-01 -4.60529e-04 7.32725e-04
4 p3 2.46734e+03 2.05722e+01 -1.17533e-02 1.76911e-05
5 p4 1.33200e+03 fixed
6 p5 -4.40476e+01 3.78071e-01 -3.20019e-04 8.44136e-04
7 p6 4.16021e+02 1.13905e+01 6.41485e-02 -6.99989e-06
8 p7 1.46100e+03 fixed
9 p8 -4.12989e+01 1.21837e+00 3.54848e-03 9.36399e-05
10 p9 1.01492e+01 3.76363e-02 -8.24277e-06 4.84923e-02
11 p10 -3.25786e-03 3.63492e-05 5.67852e-11 5.38441e+01

Thanks in advance, Nick.
cofit.C (1.91 KB)


Could you save your histogram “h” to a ROOT file h.root and post this file?

Rene

Please find attached h.root file.
h.root (6.37 KB)

In your code, there are several errors, in particular the array par not defined. I have adapted your code to get a good fit.
Note that the two solutions for the standard deviation are mathematically correct, given the way you define your function. You can force the fit
to select only a positive value by expressing a parameter range.

Rene

void cofit() {

TF1 *mine = new TF1("mine","gaus(0)+gaus(3)+gaus(6)+pol1(9)",900,1700);
mine->SetParameter(0,2000);
mine->FixParameter(1,1173);
mine->SetParameter(2,49.56);
mine->SetParLimits(2,20,100);
mine->SetParameter(3,1000);
mine->FixParameter(4,1332);
mine->SetParameter(5,49.56);
mine->SetParameter(6,100);
mine->SetParLimits(6,0,2000);
mine->FixParameter(7,1461);
mine->SetParameter(8,49.56);
mine->SetParLimits(8,40,60);
mine->SetParameter(9,1000);
mine->SetParameter(10,-1);


TFile *f = TFile::Open("h.root");
   
TH1 *h = (TH1*)f->Get("h");
h->GetXaxis()->SetRange(96,196);
h->Fit(mine,"R");
double par[11];
mine->GetParameters(par);

TF1 *gaus1 = new TF1("gaus1","gaus",900,1700);
TF1 *gaus2 = new TF1("gaus2","gaus",900,1700);
TF1 *gaus3 = new TF1("gaus3","gaus",900,1700);
TF1 *line = new TF1("line","pol1",900,1700);
gaus1->SetParameters(&par[0]);
gaus2->SetParameters(&par[3]);
gaus3->SetParameters(&par[6]);
line->SetParameters(&par[9]);
gaus1->SetLineColor(4);
gaus2->SetLineColor(4);
gaus3->SetLineColor(4);
line->SetLineColor(6);

for (Int_t q=0;q<11;q++) {
 cout << "Parameter " << q << ":  "<<par[q] << endl;
}
}
1 Like

Well, the date of post is so old, but ı am curious about it?
Is that order correct in your code? You define the mine function first as the total function, then fit it into the histogram of the data. Then, you define the individual functions of gauss1,2,3, and line as background.
Blue lined gaussians, are they the net count areas? Are they the total function of mine or the gaussians individually?

When I run the last macro posted i get the following plot which look fine.

1 Like