Ideally I would like to do this within ROOT since I can easily interact with my data. Since there doesn’t appear to be any functionality for this specifically, I have attempted to do the following:
Manually draw the axes using TGaxis.
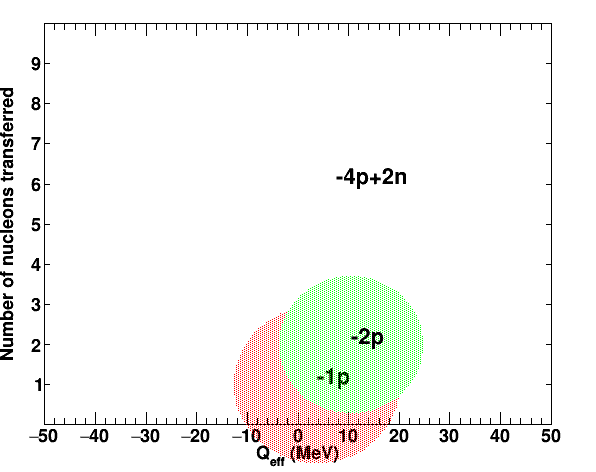
Make data points as TEllipses, making the major and minor axes the same magnitude (i.e. making them circular) which is proportional to the value of my z-axis quantity.
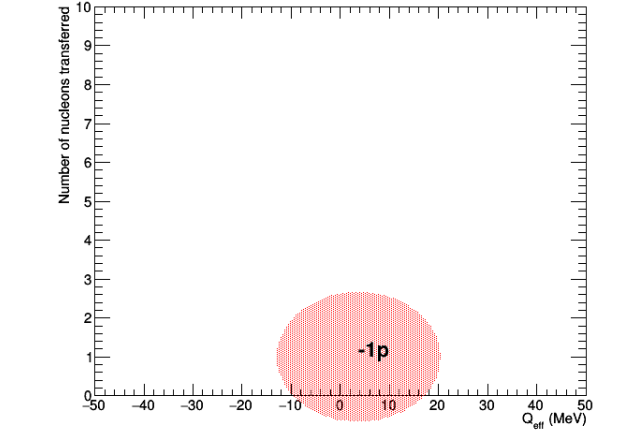
Seems to work pretty well, but for one small problem. If I have a large datapoint lower down on the y-axis, this overlaps with the x-axis. See the image below:
Is there a way for me to draw a border such that this doesn’t happen, whilst the axes remain readable? How does this work in the case of drawing histograms or TGraphs, where points outside the visible range are covered by the axes and border?
I did attempt to make something similar using a TGraph. However, since the size of the markers can only be scaled by integer values this isn’t really appropriate as it can’t accurately reflect the magnitude value.
Also generally speaking- how do I change the layer of a primitive object? Say raise the red object in the top figure above the green one, where the red one has been drawn first. Or must I always draw objects in the order in which they are layered?
As I said you need a first pass on your data to compute the right range for DrawFrame to avoid the overlap. This should be a loop very similar to the one you are using to draw the bubble but instead of drawing them you compute the min and max value of the X and Y axis.
Okay so I guess you are saying that in the above examples I need to extend the y-axis to negative values?
The problem with this is that having negative values on the y-axis is physically meaningless in this particular example, and will likely be commented on by the reviewers of my work.
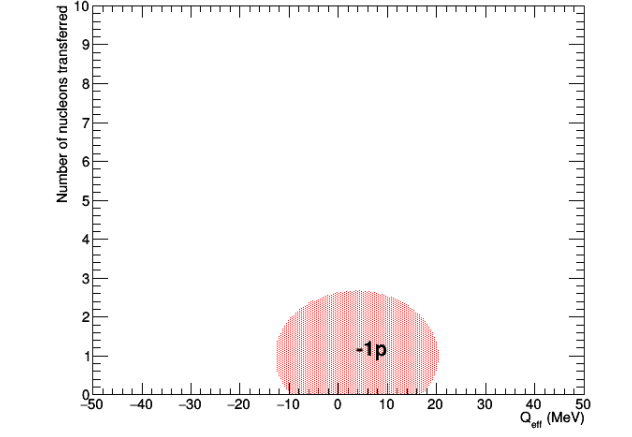
A working solution is to draw the pad frame as you suggested and instead draw the bubbles using a TCutG by setting the points according to the equation of a circle. See below:
I would still like to center the axis titles if possible (and change sizes, offsets)- how can I do this after using the TPad::DrawFrame method?