Hi,
I have a problem to plot part of a RooSimultaneous on a background subtracted spectrum, the normalization seems to be completely off.
What I did:
a) Fit a RooSimultaneous to a combined RooDataHist (16 datasets in total); fit model consists of a RooVoigtian as signal an RooChebychev as background.
b) I plotted the result projected to one spectrum with (I skipped line style options in the code snippets):
  RooPlot *framecomb = x->frame();

  // this is the combined dataset
  combData.plotOn(framecomb);

  // simPdf is the RooSimultaneous
  simPdf.plotOn(framecomb, ProjWData(combData), LineColor(kRed));

  // comps is a TString holding the 16 names of the background functions, compssig the names of the signal components
  simPdf.plotOn(framecomb, ProjWData(combData), Components(comps.Data()), LineColor(kGreen+2));
  simPdf.plotOn(framecomb, ProjWData(combData), Components(compssig.Data()), LineColor(kBlue));
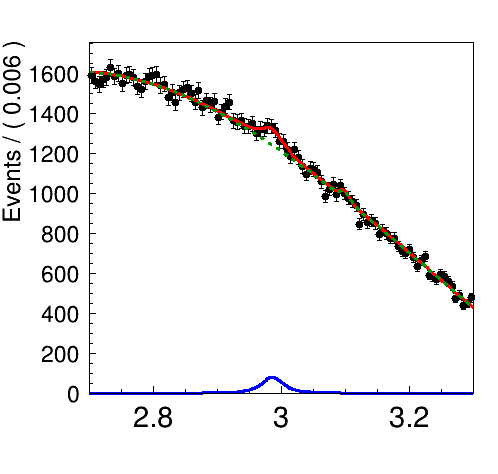
The result looks like this:
What I want to do:
a) Create and plot a background subtracted spectrum, where the green background is subtracted from the combined RooDataHist combData. I didn’t find any simple solution, so I made some brute-force approach to create the subtracted spectrum:
TH1 *htot = combData.createHistogram("htot",*x,Binning(100,xmin,xmax));
TH1F *hbkg = new TH1F("hbkg","",100,xmin,xmax);

for (int i=1;i<=16;++i)
{
  RooRealVar *b = w->var(Form("B%d",i));  // this is the number of background events, w is a RooWorkspace
  TH1* htmp = w->pdf(Form("cpol%d",i))->createHistogram("hbkg",*x,Binning(100,xmin,xmax)); //cpol_i are the Chebychev polynomials
  htmp->Scale(b->getVal());
  hbkg->Add(htmp);
  delete htmp;
}

for (int i=0;i<=htot->GetNbinsX(); ++i)
  htot->SetBinContent(i, htot->GetBinContent(i) - hbkg->GetBinContent(i));

RooDataHist *hsub = new RooDataHist("hsub","",*x, Import(*htot));
b) Plot on top the blue combined signal pdf.
What I tried so far is:
RooPlot *framesub = x->frame("Subtracted spectrum");
hsub->plotOn(framesub);
simPdf.plotOn(framesub, ProjWData(combData),  Components(compssig.Data()), LineColor(kBlue));
framesub->Draw();
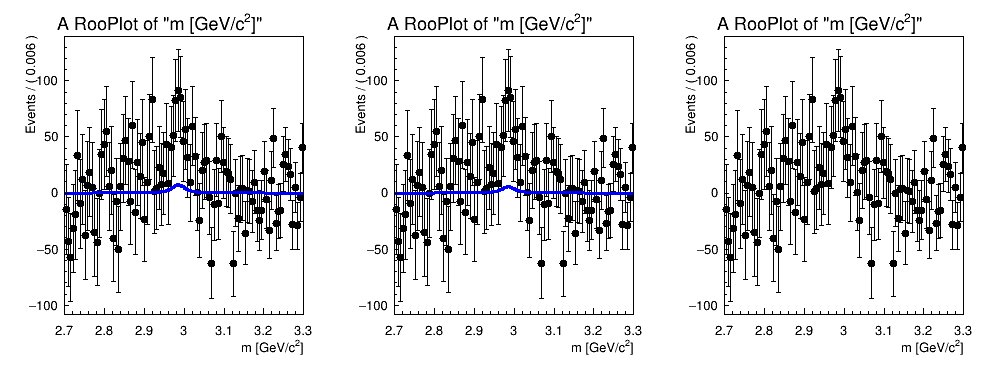
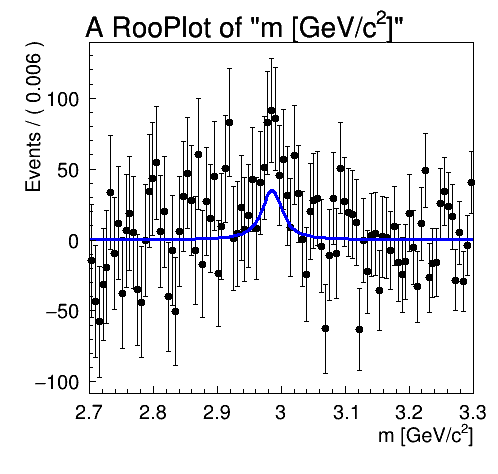
The outcome is
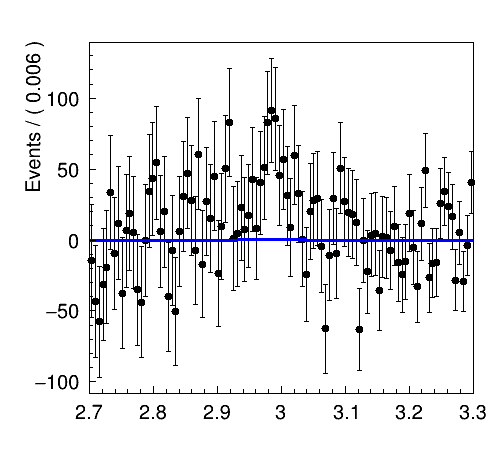
It looks like if the blue line is flat, but when you zoom in you see that it is the right pdf, but normalized wrongly:
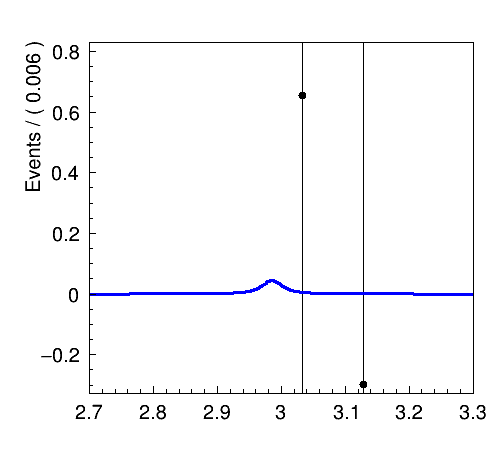
I already tried to compensate this with the option Normalization(sum_events, RooAbsReal::Relative), which scales it up but still doesn’t match the real line shape.
Can anybody help me with that?
Best regards and thanks,
Klaus