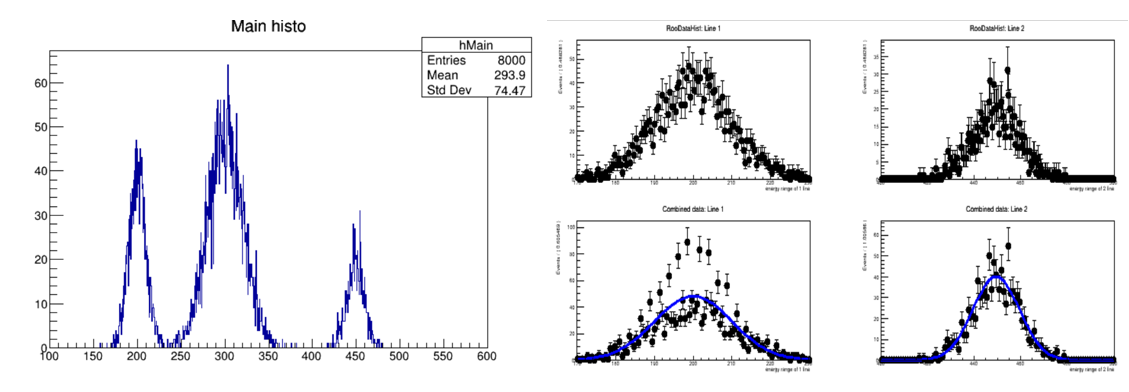
I am trying to fit two lines in the spectrum at the same time, while two simultaneously fitted categories have different axes (in all examples with RooSimultaneous, the categories have the same axis). Below is the code of the program. Almost everything works, the only problem is that after creating the combined data, when accessing them, I see a strange “doubling” of the first line, in general, the amount of data is different. It seems that the combined data is not generated quite correctly due to the different axes in the added categories. How can I fix this error?
#include <TH1.h>
#include <TF1.h>
#include <RooRealVar.h>
#include <RooGaussian.h>

// try to fit two lines simultaneously
void rf_example() {

  double emin=100,emax=600;

  // generate 3 gaus lines
  TH1F *h= new TH1F("hMain","Main histo",1024,emin,emax);
  TF1 *f = new TF1("f","gaus",emin,emax);
  f->SetParameters(10,200,10);
  h->FillRandom("f",2000);
  f->SetParameters(10,300,20);
  h->FillRandom("f",5000);
  f->SetParameters(10,450,10);
  h->FillRandom("f",1000);

  h->Draw();

  // simultenous fit of 2 lines (1 & 2)
  RooRealVar E1("E1","energy range of 1 line",170,230);
  RooRealVar E2("E2","energy range of 2 line",400,500);
  RooRealVar P1("P1","Position of 1 line",180,220);
  RooRealVar P2("P2","Positions of 2 line",420,470);
  RooRealVar S("S","sigma of lines",0,20) ;
  RooGaussian L1("Line1","Line 1",E1,P1,S) ;
  RooGaussian L2("Line2","Line 2",E2,P2,S) ;

  RooCategory category("category","Category");
  category.defineType("Line1");
  category.defineType("Line2");

  RooSimultaneous model("model","Simultaneous fit of 2 lines",category) ;
  model.addPdf(L1,"Line1");
  model.addPdf(L2,"Line2");

  // build data set
  //  RooRealVar E("E","Full energy range",emin,emax);
  RooDataHist dE1("dE1","Line 1 data",E1,h);
  RooDataHist dE2("dE2","Line 2 data",E2,h);

  // Construct combined dataset in (x,sample)
  RooDataHist combData("combData", "combined data", RooArgSet(E1,E2), RooFit::Index(category), RooFit::Import("Line1", dE1),
                       RooFit::Import("Line2",dE2));

  // Plot results
  RooPlot *frame1 = E1.frame(RooFit::Title("RooDataHist: Line 1"))
	 ,*frame2 = E2.frame(RooFit::Title("RooDataHist: Line 2"));

  dE1.plotOn(frame1);
  dE2.plotOn(frame2);

  // fit
  model.fitTo(combData);

  RooPlot *frame3 = E1.frame(RooFit::Title("Combined data: Line 1"))
	 ,*frame4 = E2.frame(RooFit::Title("Combined data: Line 2"));

  combData.plotOn(frame3, RooFit::Cut("category==category::Line1"));
  combData.plotOn(frame4, RooFit::Cut("category==category::Line2"));
  model.plotOn(frame3,RooFit::Slice(category, "Line1"), RooFit::ProjWData(category,combData));
  model.plotOn(frame4,RooFit::Slice(category, "Line2"), RooFit::ProjWData(category,combData));

  // Plot results

  TCanvas *c = new TCanvas("rf_sample", "rf_sample", 800, 400);
  c->Divide(2,2);
  c->cd(1);
  frame1->Draw();
  c->cd(2);
  frame2->Draw();
  c->cd(3);
  frame3->Draw();
  c->cd(4);
  frame4->Draw();

} // rf_example