Hello experts,
I am trying to create a 2d pdf from a 2d weighted histogram, then use the 2d pdf to fit some data. The fit worked but there was something strange for the plotting.
-
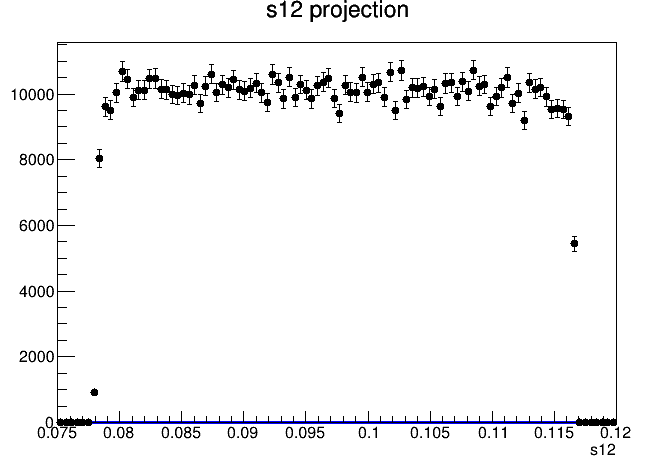
If I plot
dataHistT1only, I can get projection of the original histogram as expected. -
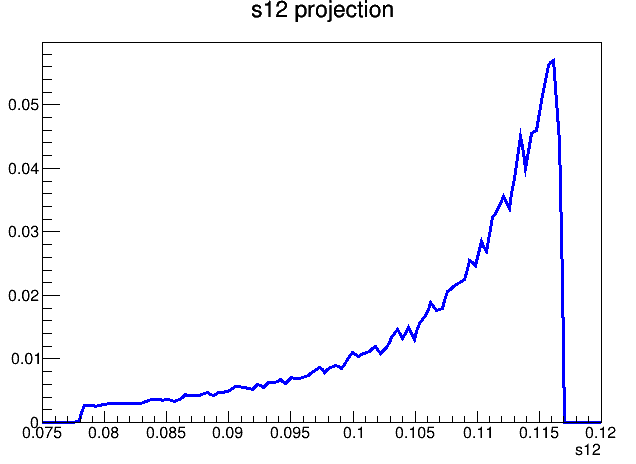
If I plot
modelonly, the plot seems to be normalized to 1 instead of the number of events. And the shape does not look right.
-
If I plot
modelfirst, thendataHistT1.modelseems to be normalized to 1.
-
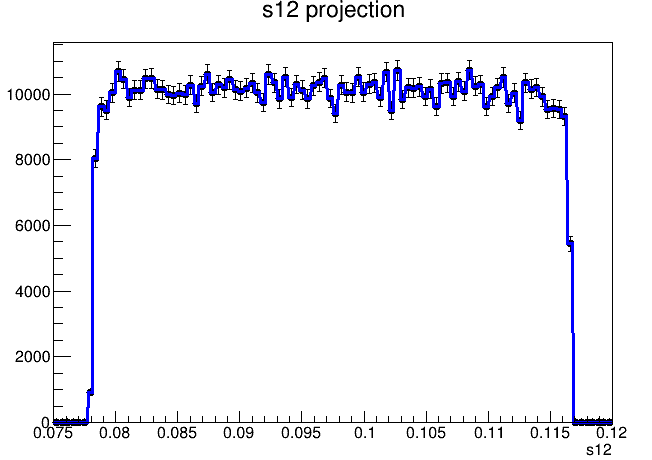
If I plot
dataHistT1first, thenmodel. I see a good agreement between the fitted model and the data.
I am glad I found a way myself but I have no idea why 2) and 3) did not work. Can someone tell me what I did wrong?
Thanks
The code:
#include <iostream>
#include <vector>
#include <string>
#include <memory>

#include "TCanvas.h"
#include "TFile.h"
#include "TH2D.h"
#include "TFractionFitter.h"
#include "TObjArray.h"

#include "RooRealVar.h"
#include "RooDataHist.h"
#include "RooDataSet.h"
#include "RooHistPdf.h"
#include "RooHistFunc.h"
#include "RooAddPdf.h"
#include "RooRealSumPdf.h"
#include "RooPlot.h"
#include "RooGaussian.h"

using namespace RooFit;
using std::cout;
using std::endl;

void create_and_plot_pdf()
{
    TH1::AddDirectory(kFALSE);

    RooRealVar s12("s12", "s12", 0.075, 0.12);
    RooRealVar s13("s13", "s13", 5.85, 6.2);

    RooRealVar a1("a1", "T1 counts", 1e6, 0, 1e9);
    auto fTemps = new TFile("amps.root");
    auto histT1 = (TH2D*)fTemps->Get("hist_dalitz_T1");
    auto dataHistT1 = new RooDataHist("dataHistT1", "dataHistT1",
        RooArgSet(s12, s13), histT1);
    // Create PDF from histograms with 1st order interpolation
    RooHistPdf pdfT1("pdfT1", "pdfT1", RooArgSet(s12, s13), *dataHistT1, 1);

    RooAddPdf model("model", "model", RooArgList(pdfT1), RooArgList(a1));

    model.fitTo(*dataHistT1, Extended(kTRUE), Save());

    RooPlot * s12Frame = s12.frame(Title("s12 projection"));

    // pdfT1.plotOn(s12Frame);
    dataHistT1->plotOn(s12Frame);
    // Model has to be plotted at last to ensure correct normalization
    model.plotOn(s12Frame);
    s12Frame->Draw();
}
