RooFit subrange fit different from full fit

Dear All,

I want to perform a fit in two side-band regions, for example (110,120) and (130,160). As a check, I performed the fit in the side-bands that I expect to be equivalent to the full fit, (110,115)+(115,160) = (110,160):

x.setRange('low',110,115)  # low side-band range
x.setRange('high',115,160) # high side-band range
x.setRange('full',110,160) # full range
fitResultFull     = pdf.fitTo(data,Range("full"))
fitResultSideBand = pdf.fitTo(data,Range("low,high"))

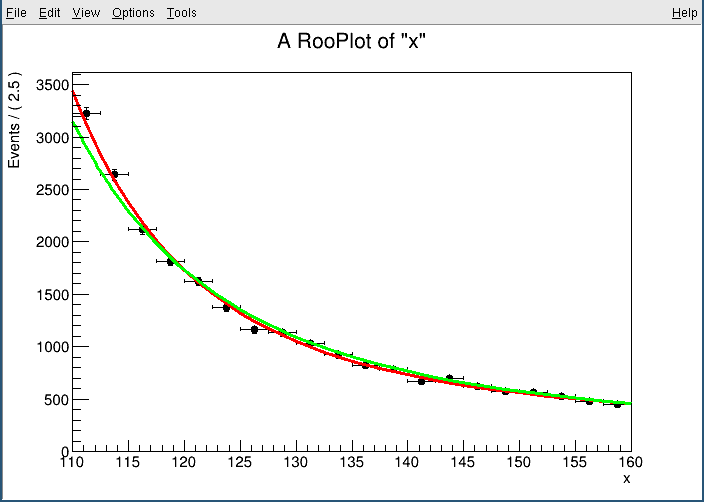
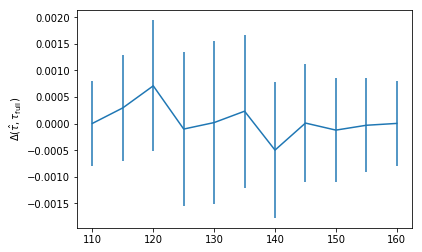
However, for these two fits I get slightly different results. Is there any reason to expect this?

=== Minimal example ===
This is a minimal working example as an illustration using pyroot, python 2.7, ROOT 6.12. The input workspace is attached and saved in save.root

import sys
# please change to point to a python2, root 6.12 pyroot installation
# sys.path = ["path"] + sys.path
import ROOT # using ROOT 6.12

# load from saved file
f=ROOT.TFile("save.root","update")
w=f.Get("w")

# these objects should be in the workspace
bkgName="bkgDijetGgh1"
bkgPdfName="bkgPdfDijetGgh1"

# set up workspace
cut=115
w.var('x').setRange('low',110,cut)
w.var('x').setRange('high',cut,160)
w.var('x').setRange('full',110,160)
x=w.var('x')

# make plot
frame = x.frame()
data=w.obj(bkgName)
data.plotOn(frame)

# full
pdf = w.pdf(bkgPdfName).Clone()
fitResult = pdf.fitTo(data,ROOT.RooFit.Range("full"))
pdf.plotOn(frame,ROOT.RooFit.Normalization(1,ROOT.RooAbsReal.Relative),ROOT.RooFit.LineColor(2))

# part (side band fit)
pdf = w.pdf(bkgPdfName).Clone()
fitResult = pdf.fitTo(data,ROOT.RooFit.Range("low,high"))
pdf.plotOn(frame,ROOT.RooFit.LineColor(3))

# draw plot and keep open
frame.Draw()
raw_input()

save.root (13.7 KB)

Maybe @moneta could help…

Hi,
from the statistical point of view is perfectly fine.
I mean also if the data came from the same distribution, using only a part of the data set you will have less info with respect to fitting all the data sets.
If there aren’t any pathological points a fit done with more points should be more reliable with respect to one with less points.

Stefano

Hi @Dilicus,

My question may not have been clear. I am comparing fits done on the same data: once in the full range, once in two sub-ranges adding up to the full range:

  • 110-160
  • 110-115, 115-160

For (what I imagine) should be the same fit, I get different results. Does that make sense? Am I misunderstanding how the sub-ranges work?
Thanks for your help,
Aaron

Sorry, I misunderstood your question, so my point has no basis at all
Maybe I’m not the right person to answer your question.
The only other suggestion I can give to you is:
put a dot in the cut, and the extrema of the ranges, because I don’t know how pyton handle the conversion from int to double.

Stefano

Hi @Dilicus,

Thanks for the suggestion - unfortunately I still get different fits after changing 160 -> 160.0 etc.

Is there someone else who can help with this? :slight_smile:

Thanks,
Aaron

Post to keep this issue open.

Hi @moneta, you were suggested as someone who could address this question. Do you have any input? Thanks

Hi Aaron, indeed this is strange as the fitTo object should take a list of comma separated ranges as the fit range https://root.cern.ch/root/html524/RooAbsPdf.html#RooAbsPdf:fitTo

I’ll try to look into it a little more whilst Lorenzo is away

Hi vcroft,

Thanks very much! If there’s any information or clarification I can provide, please let me know.

Thanks,

Aaron

okey dokey. I’ve modified your example for a standalone result

import ROOT # using ROOT 6.12

c1 = ROOT.TCanvas()
w = ROOT.RooWorkspace("w")
ex1 = w.factory('Exponential::pdf(x[110,160], tau[-.05,-200,200])')
x = w.var('x')
x.setBins(20)
data = ex1.generate(ROOT.RooArgSet(x), 10000)
# set up workspace
cut=115
w.var('x').setRange('low',110,cut)
w.var('x').setRange('high',cut,160)
w.var('x').setRange('full',110,160)


# make plot
frame = x.frame()
data.plotOn(frame)

# full
pdf = w.pdf('pdf').Clone()
firstfitResult = pdf.fitTo(data,ROOT.RooFit.Range("full"),ROOT.RooFit.Save())
pdf.plotOn(frame,ROOT.RooFit.Normalization(1,ROOT.RooAbsReal.Relative),ROOT.RooFit.LineColor(2))

# part (side band fit)
pdf = w.pdf('pdf').Clone()
secondfitResult = pdf.fitTo(data,ROOT.RooFit.Range("low,high"),ROOT.RooFit.Save())
pdf.plotOn(frame,ROOT.RooFit.LineColor(3))

# draw plot and keep open
frame.Draw()
c1.Draw()

then we asses the result with

firstfitResult.Print()
RooFitResult: minimized FCN value: 36876.7, estimated distance to minimum: 4.29596e-06
                covariance matrix quality: Full, accurate covariance matrix
                Status : MINIMIZE=0 HESSE=0 

    Floating Parameter    FinalValue +/-  Error   
  --------------------  --------------------------
                   tau   -4.9851e-02 +/-  7.99e-04

and

secondfitResult.Print()

RooFitResult: minimized FCN value: 31543.6, estimated distance to minimum: 7.33732e-07
                covariance matrix quality: Full, accurate covariance matrix
                Status : MINIMIZE=0 HESSE=0 

    Floating Parameter    FinalValue +/-  Error   
  --------------------  --------------------------
                   tau   -5.0763e-02 +/-  1.44e-03

Result

Indeed there’s a minor difference. I’m guessing this is to do with the algorithm (migrad) with which the minimiser acts on one vs two likelihood components coupled together with the accuracy of the two vs one integral. I tried using different cuts and got the following difference from the full integral result. Every single cut value is well within the uncertainty on the result and I expect (possibly naively) that this will go down with a more dense parameter structure (due to the nature of the line search used)
deltatau

Hi @vcroft,

Thank you very much for your help. Unfortunately in my example fit&data, some of the fit parameters are outside of the of their errors. For example, here’s the printout of the fit result (see bParam4DijetGgh1):

Full fit:
  RooFitResult: minimized FCN value: 86675.2, estimated distance to minimum: 0.00941011
                covariance matrix quality: Full, accurate covariance matrix
                Status : MINIMIZE=-1 HESSE=4 

    Floating Parameter    FinalValue +/-  Error   
  --------------------  --------------------------
      bParam0DijetGgh1    5.9899e+00 +/-  9.85e-01
      bParam1DijetGgh1   -8.7544e+00 +/-  2.07e+00
      bParam2DijetGgh1   -7.2876e+00 +/-  1.50e+00
      bParam3DijetGgh1    5.6444e-01 +/-  6.69e-01
      bParam4DijetGgh1    7.8362e-01 +/-  1.53e-01

Side-band fit:
  RooFitResult: minimized FCN value: 73547.7, estimated distance to minimum: 0.0182839
                covariance matrix quality: Full matrix, but forced positive-definite
                Status : MINIMIZE=-1 HESSE=4 

    Floating Parameter    FinalValue +/-  Error   
  --------------------  --------------------------
      bParam0DijetGgh1    5.0402e+00 +/-  9.59e-01
      bParam1DijetGgh1   -5.5434e+00 +/-  5.61e-01
      bParam2DijetGgh1   -6.3813e+00 +/-  2.15e-01
      bParam3DijetGgh1   -9.7250e-01 +/-  1.36e-01
      bParam4DijetGgh1    2.7940e-01 +/-  2.47e-02

Here’s a side-by-side comparison between my fit (left) and your fit to the generated data (right). It looks like the difference doesn’t show up in your fit (maybe because the pdf generated the data?). What I’m worried about is the rare cases where it does show up…

Thanks very much, your help is greatly appreciated,
Aaron

Hi Aaron.

I’m sorry I’m struggling to see the RooFit issue here, this looks to me like a problem with the model. There will be numerical issues relating to the problem of performing the fit over two summed integrals rather than one continuous one. But that doesn’t obviously relate to the issue that you mention here.

If a distribution is well described by only one parameter then the addition of many additional parameters can lead to instabilities (as the problem becomes unbounded). It could be that these additional parameters are systematics (Gaussian constrained with a fixed subsidiary measurement) or it could be something else.

Hi @vcroft,

Thanks for your reply. From my perspective I think I’m asking RooFit to do identical tasks and getting different output, ie if I had a function sum(a,b) but I get sum(2,2) != sum(1+1,1+1).

I might be mistaken about how I expect RooFit to behave? If so is there a way for me to get the behavior that I need (identical fits in identical ranges)?

Thanks for your help in explaining this,
Aaron

Hi Aaron. But indeed sum(2,2) != sum(1+1, 1+1) since what you’re essentially doing is sum(2±0.5, 2±0.5) = 4±0.7 vs sum(1±0.5 + 1±0.5, 1±0.5 + 1±0.5) = 4±1. Now RooFit and Minuit has a lot of tools inside to try and avoid summation errors such as these and to mitigate numerical errors and indeed in the RooFit dev team we recently spent the better part of three months to get floating point agreement for likelihoods split over the multiprocess interface. I’m afraid these sorts of numerical issues are part of scientific computing.

One other way to do this is to split your model into a histogram and then split this into bins. but that’s only going to agree because you’re already splitting the model into several likelihood components.
~/Vince

Hi @vcroft,

Thanks for the help and the explanation, I will keep this in mind in the future. I guess this topic can be closed.

Aaron

This topic was automatically closed 14 days after the last reply. New replies are no longer allowed.