Hi , I’m trying to use roofit twice fitTo same data but with different range like the follwing
RooAddPdf RooDsMixPdf(“RooDsMixPdf”,“RooDsMixPdf”,RooArgList(SigPdf,BkgPdf),RooArgList(NumSig,NumBkg));
Dmass.setRange(“range1”,1.91,2.06);
Dmass.setRange(“Allrange”,1.91,2.11);
RooDsMixPdf.fitTo(RooDS,Extended(kTRUE),Range(“range1”));
RooFitResult *fitresult = RooDsMixPdf.fitTo(RooDS,Extended(kTRUE),Range(“Allrange”),Save());
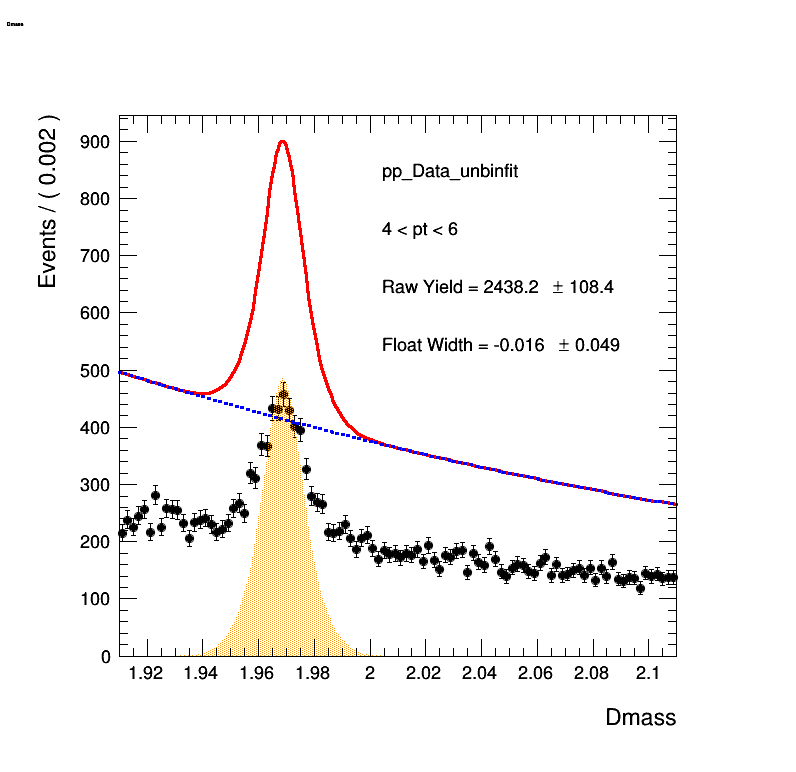
RooDsMixPdf.plotOn(massframe,LineColor(2));
The first fit is to give better initial parameter for second fit, which sometimes failed without the first fit. The fitting result by this way is ok, but when draw the plot, it clearly wrong, it seems it stack both fitting result into one fit, if i do the fit with different range 3 times, it will goes higher. Does anyone know how to solve this problem? Thanks.