Hi all,
Meanwhile I discovered that what is giving problem is the analytical integration method provided, which does not support negative domain even though the evaluate method supports it.
In fact if I modify it with this workaround:
class AdHocLognormal : public RooLognormal
{
public:
  AdHocLognormal( const char *name, const char *title,
                  RooAbsReal &_x, RooAbsReal &_m0, RooAbsReal &_k)
  : RooLognormal{name, title, _x, _m0, _k}
  { }
  AdHocLognormal(const AdHocLognormal &other, const char *name = nullptr)
  : RooLognormal{other, name}
  { }
  TObject *clone(const char *newname) const override { return new AdHocLognormal(*this, newname); }

  // Correct this calculation to allow for negative range extension
  double analyticalIntegral(Int_t code, const char *rangeName = nullptr) const override
  {
    static const double root2 = std::sqrt(2.);

    double ln_k = std::abs(_useStandardParametrization ? k : std::log(k));
    double scaledMax = _useStandardParametrization ? std::log(x.max(rangeName)) - m0 : std::log(x.max(rangeName) / m0);
    if ( x.min(rangeName) <= 0. )  // <--- here is the modification
      return 0.5 * (RooMath::erf(scaledMax / (root2 * ln_k)) + 1.);
    double scaledMin = _useStandardParametrization ? std::log(x.min(rangeName)) - m0 : std::log(x.min(rangeName) / m0);
    return 0.5 * (RooMath::erf(scaledMax / (root2 * ln_k)) - RooMath::erf(scaledMin / (root2 * ln_k)));
  }
};
I can have a functional lognormal distribution valid on the whole real axis, probability density is just zero in the negative half of the axis. Likewise, as soon as the range is at least partially positive, also the normalization can be calculated analytically, the negative fraction just adds 0 to the integral.
I verified that the code can (see picture below) plot the lognormal with a negative range (dashed blue), convolve (blue) it with the (dash green) gaussian, convolve it with a clone of itself (dash violet) and then also with the gaussian (violet). I can also combine all of them in a RooAddPdf (not in the plot, I can add it).
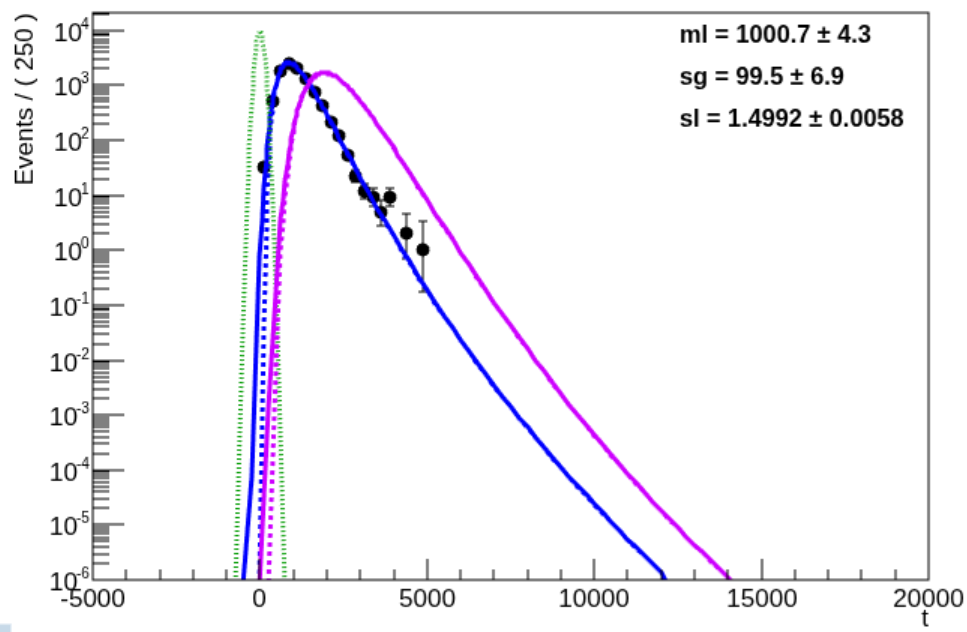
So now the question is: was there an oversight in the analytical integral code, or is there a specific theoretical/statistics reason why you want to forbid the definition over the full real axis? (You know, you get the warning when you define the Pdf that the “safe” range is ]0;+inf[ )
Thanks again for any feedback,
Matteo