RooFit Error Band Shrinks

Hello experts,

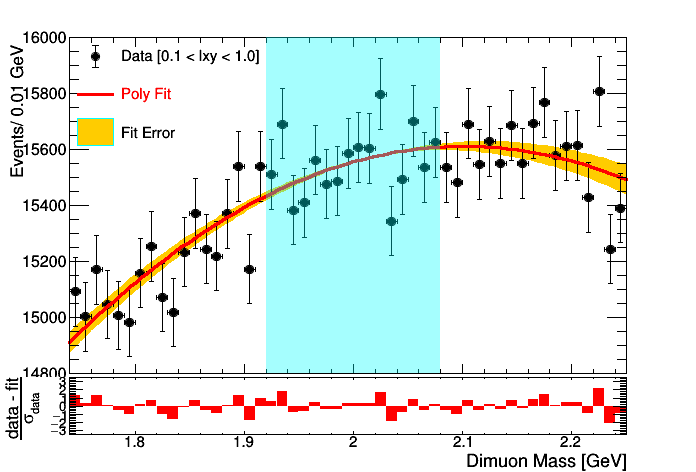
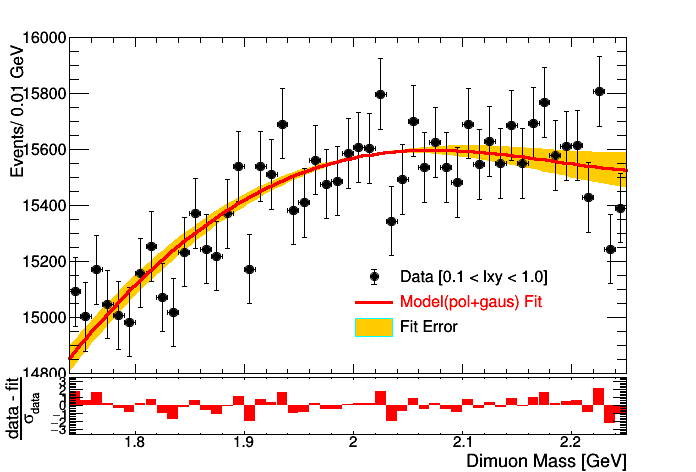
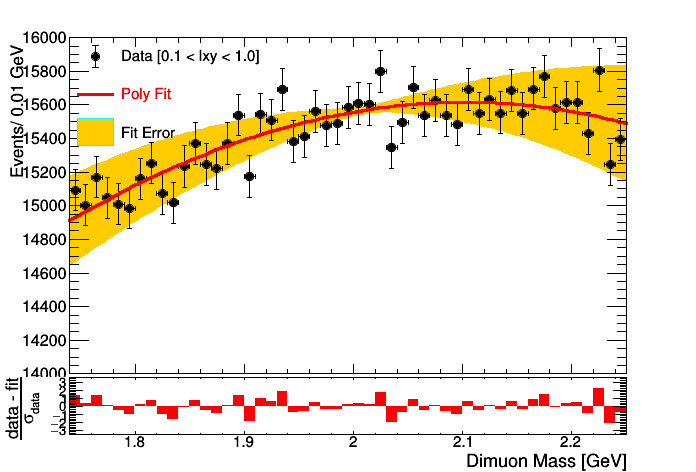
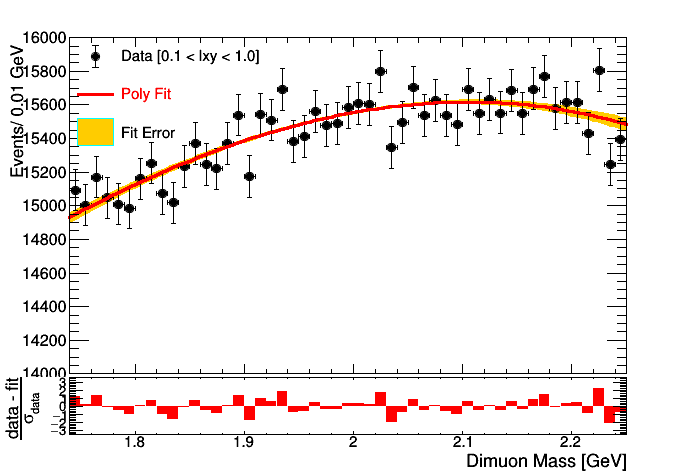
I am doing a likelihood fit using roofit by masking the signal region. I am wondering why the error band using VisualizeError() from RooFit shrinks in the middle. If I use signal+background pdf the problem still remains.

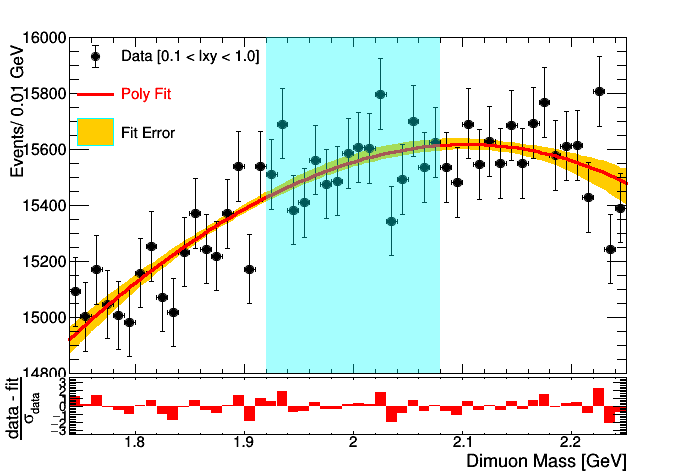
I have attached the plot of both fits. (masked binned likelihood fit and unmasked(S+B) binned likelihood fit). Also below is a relevant part of the code.

I have also tried changing the intitial parameters to be close the converged values but that too doesn’t help.

x = ROOT.RooRealVar("x","x",float(xfitdown),float(xfitup))
x.setRange("R1",float(xfitdown),float(xsigdown))
x.setRange("R2",float(xsigup),float(xfitup))
l = ROOT.RooArgList(x)

data = ROOT.RooDataHist("data", "data", l, data_obs)

p0 =  ROOT.RooRealVar("p0","p0",1000,-10000000,10000000)
p1 =  ROOT.RooRealVar("p1","p1",-1000,-10000000,10000000)
p2 =  ROOT.RooRealVar("p2","p2",-1000,-10000000,10000000)
p3 =  ROOT.RooRealVar("p3","p3",-1000,-10000000,10000000)
p4 =  ROOT.RooRealVar("p4","p4",-1000,-10000000,10000000)
p5 =  ROOT.RooRealVar("p5","p5",20000,-10000000,10000000)
p6 =  ROOT.RooRealVar("p6","p6",100000,-10000000,10000000)
 
background = ROOT.RooPolynomial("background","background", x, ROOT.RooArgList(p0,p1,p2,p3,p4,p5,p6))
        
nB = data_obs.Integral()
background_norm = ROOT.RooRealVar("background_norm","background_norm",nB,0.9*nB,1.1*nB)
model = ROOT.RooAddPdf("model","model",ROOT.RooArgList(background),ROOT.RooArgList(background_norm))
result = ROOT.RooFitResult(model.fitTo(data, ROOT.RooFit.Range("R1,R2"), ROOT.RooFit.Save(ROOT.kTRUE), ROOT.RooFit.Minimizer("Miniuit", "Migrad")))
model.fitTo(data,ROOT.RooFit.Range("R1,R2"))
bkg_component = ROOT.RooArgSet(background)
xframe = x.frame(ROOT.RooFit.Title("Fit"))
data.plotOn(xframe, ROOT.RooFit.Name("data"))
model.plotOn(xframe, ROOT.RooFit.VisualizeError(result,1), ROOT.RooFit.Components(bkg_component), ROOT.RooFit.Name("errorband"), ROOT.RooFit.FillColor(ROOT.kOrange), ROOT.RooFit.Range("Full"), ROOT.RooFit.NormRange("Full"))
data.plotOn(xframe, ROOT.RooFit.Name("data"))
model.plotOn(xframe,ROOT.RooFit.LineColor(3),ROOT.RooFit.Components(bkg_component), ROOT.RooFit.Name("bkg"), ROOT.RooFit.LineStyle(2), ROOT.RooFit.Range("Full"), ROOT.RooFit.NormRange("Full"))

I guess @StephanH can give an explanation

Hey there,

the error bands are calculated from the errors (and correlations) of the fit parameters. I would therefore advise to print and compare the fit results.

One thing I noticed is this:

This shouldn’t work (typo: Miniuit), so it’s probably falling back to the default minimiser. Check the logs if it’s complaining.

True I had a typo but somehow it was fitting. But as I changed it the error band blows up and still shrinks in the middle.
I have attached the roofit logs containing the fit parameters, errors etc(v0 is for typo and v1 after correcting typo to minuit). There seems to be roofit errors(negative diagonal elements in error matrix) in both the logs but it is hard for me to figure what could be resulting in that.

Initialization of the coefficients seems to affect it. So I changed all the initial values to 1 keeping bounds the same. The error matrix issue got resolved and error band doesn’t blow up but still the error band shrinks in middle. Also attached the roofit log (v2) and plot for the same.

And it says.
MIGRAD MINIMIZATION HAS CONVERGED.
MIGRAD WILL VERIFY CONVERGENCE AND ERROR MATRIX.
COVARIANCE MATRIX CALCULATED SUCCESSFULLY

Roofit Logs:

roofit_log_v0.txt (238.6 KB)
roofit_log_v1.txt (295.8 KB)
roofit_log_v2.txt (227.2 KB)

Fit plots:


I had a look at the first log, and I see extremely high correlations. I guess that you therefore need to use the slow, but more accurate method of evaluating the error bands. Check out the relevant part of the docs here:
https://root.cern.ch/doc/master/classRooAbsReal.html#a32073d896314ad08535328f556379780

I changed it to ROOT.RooFit.VisualizeError(result,1,ROOT.kFALSE) and I get the following errors. Looks like the error matrix is not positive definite. That will also be the reason for thinning error band in linearized method. What could be the solution?

Error in TDecompLU::DecomposeLUCrout: matrix is singular
[#0] ERROR:Eval – RooFitResult::createHessePdf(fitresult_model_data) ERROR: covariance matrix is not positive definite (|V|=-0) cannot construct p.d.f
[#1] INFO:Plotting – RooAbsReal::plotOn(model) INFO: visualizing 1-sigma uncertainties in parameters (p0,p1,p2,p3,p4,p5,p6,background_norm) from fit result fitresult_model_data using 315 samplings.

Actually I had made the background_norm constant while trying out the recent fit. I changed it back. background_norm = ROOT.RooRealVar(“background_norm”,“background_norm”,nB,0.9nB,1.1nB)

So ROOT.RooFit.VisualizeError(result,1,ROOT.kFALSE) now works and error matrix is positive definite. The error bands are still narrowing down in the middle portion though.

I was going to say that reducing the number of parameters can improve the problem with correlations, so it’s good that you already found that it works.

However, I wonder if it’s not expected that error bands in the middle of the plot are smaller if you use a polynomial of high degree. I guess that the coefficients are chosen such that it’s “centred” at about 2. So if you go far from 2, the terms with high powers of x just start to explode. Therefore, when you wiggle the relevant coefficients just a little bit (within their fit errors), you get higher uncertainties at the sides.

True it has something to do with choosing of coefficients. I managed to get a non-negligible but assymetric error band in the middle using sampling method for polynomial order 6 by changing initial coefficients . True lowering the polynomial order makes the error band wider but it makes it too wide.

However error band looks good when I use Chebyshev or Bernstein polynomials. However I am being unable to implement it for higher orders. I get the following error.

" In evaluate (/build/cmsbld/auto-builds/CMSSW_10_2_1-slc6_amd64_gcc700/build/CMSSW_10_2_1-build/BUILD/slc6_amd64_gcc700/lcg/root/6.12.07-gnimlf5/root-6.12.07/roofit/roofit/src/RooChebychev.cxx, line 125): Higher order Chebychev polynomials currently unimplemented.
Fatal: false violated at line 127 of `/build/cmsbld/auto-builds/CMSSW_10_2_1-slc6_amd64_gcc700/build/CMSSW_10_2_1-build/BUILD/slc6_amd64_gcc700/lcg/root/6.12.07-gnimlf5/root-6.12.07/roofit/roofit/src/RooChebychev.cxx’
aborting"

Is it only a root version issue or is there any other way to implement higher order chebyshev,bernstein in root 6.12 ?

The polynomials were hard-coded in older root versions. I don’t remember where the switch happened, but let’s say in 6.18 or so, the recursive definition is used, so you can go to high orders.

This topic was automatically closed 14 days after the last reply. New replies are no longer allowed.