RooFit: Custom PDF integration fails with threshold

Hi,

I have a problem with the integration of my custom PDF classes.
Each of them describes a fit component of a RooAddPdf model in 2D (x, y), by smearing an input TH1F spectrum along a certain line with given resolutions sigma_x, sigma_y. These extended PDFs worked well so far.
But then I wanted to perform a simultaneous fit over several detectors (with different data sets and PDFs), for which I need to add different thresholds in variable x in my model. E.g. detector 1 starts with data from x=0.9, and detector 2 with data from x=1.5. For this I added to my custom PDF a threshold variable, so that the PDF returns 0 if xthreshold. The idea was to have up to 8 different data sets, each only with data for which the x>=threshold for this detector. The corresponding PDFs should then also only start from this threshold.

See the figure showing the PDF with a threshold at 1.5:


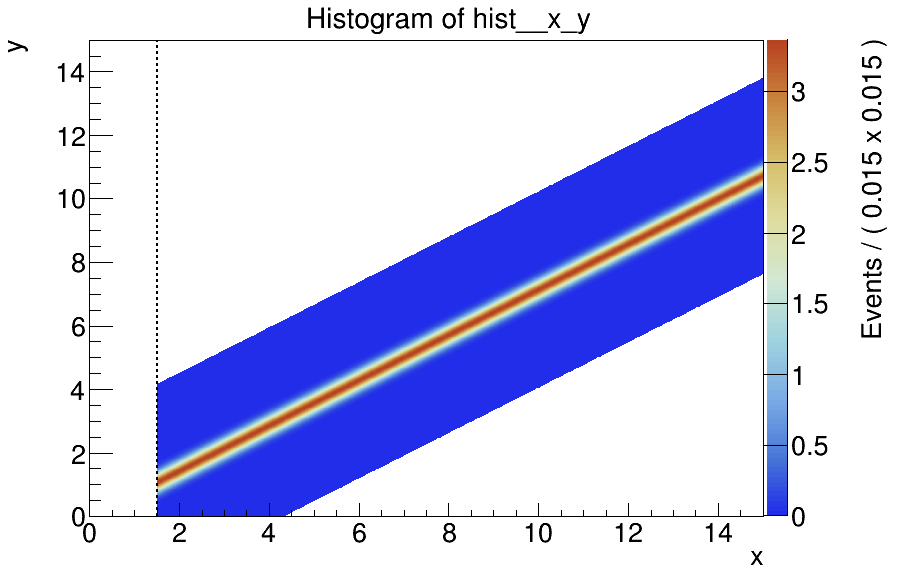
With this threshold, the PDFs are now not properly integrated/normalized, at least not for the range and sigma-values I am using (and which I cannot change). Of course a simultaneous fit then fails or gives wrong results.

Here’s an example script to show the problem, the python code and the PDF class can be found in the attachments:

#!/usr/bin/env python
import ROOT
from ROOT import RooFit as RF

ROOT.gSystem.Load("TestPdf_cxx.so")

# Create spectrum and fill it with constant values
spectrum = ROOT.TH1F("spectrum", "spectrum", 100, 0, 30)
for bin in range(1,spectrum.GetNbinsX()+1):
  spectrum.SetBinContent(bin, 1.0)

# Create workspace and variables
w = ROOT.RooWorkspace("w")
x = w.factory("x[0,15]")
y = w.factory("y[0,15]")
sigma_x = w.factory("sigma_x[0.1]")
sigma_y = w.factory("sigma_y[0.2]")
threshold = w.factory("threshold[1.5]")

# Create pdf and 2D histogram
pdf = ROOT.TestPdf("pdf", "pdf", x, y, sigma_x, sigma_y, threshold, spectrum)
hist = pdf.createHistogram("hist", x, RF.Binning(1000), RF.YVar(y, RF.Binning(1000)))

# Compare integral of histogram with normalization integral
print "hist integral = ", hist.Integral("WIDTH")
print "pdf integral = ", pdf.expectedEvents( ROOT.RooArgSet(x, y) )

hist.Draw("COLZ")

I already tried using MC integration, but that’s slower and less accurate, which might be a problem for me. Plus I had some problems with this, using more complicated classes:

ROOT.RooAbsReal.defaultIntegratorConfig().method2D().setLabel("RooMCIntegrator")
ROOT.RooAbsReal.defaultIntegratorConfig().getConfigSection("RooMCIntegrator").setRealValue("nIntPerDim",5000)

Also I tried increasing the integration precision:

ROOT.RooAbsReal.defaultIntegratorConfig().setEpsAbs(1e-300)
ROOT.RooAbsReal.defaultIntegratorConfig().setEpsRel(1e-300)

Is there any other way to improve the integration or my PDF description to make things work? I am using ROOT version 6.05.02 via pyroot.
TestPdf.h (1.47 KB)
TestPdf.cxx (2.27 KB)
test_threshold_pdf.py (1.19 KB)

Hi,

First of all you should not use TH1F class (based on single precision) for computing a double quantities like the integral which will be used later to compute the likelihood, which requires double precision !
In general use always a TH1D, this should be always anyway the default.
Use a TH1F only when you need to control the memory allocated by the histogram

Lorenzo

Hi,

thanks, I changed all code into using double precision. Unfortunately this doesn’t help with the integration so far.
Also, I did not find out, how to get a TH1D histogram from a PDF via the createHistogram() method using pyROOT. What I get is always a TH1F. In C++ this seems to be different.

Here’s the updated code:
TestPdf.cxx (2.27 KB)
TestPdf.h (1.47 KB)
test_threshold_pdf.py (904 Bytes)

Best regards,
Lukas

Hi,

Thank you for the code. I could reproduce the problem. It seems coming from createHistogram(). The Integral of the returned histogram should be 1 instead has a different value
However if I compute the integral from a TF2 returned from asTF method, the result is correct.

auto f2 = (TF2*) pdf->asTF(RooArgList(*x,*y)); 
auto f2norm = (TF2*) pdf->asTF(RooArgList(*x,*y), RooArgList(), RooArgList(*x,*y));

cout << f2->Integral(0,15,0,15) << endl;
cout << f2norm->Integral(0,15,0,15) << endl;

I would need to check the createHistogram code

Lorenzo

Hi,

Checking more on this issue, I can confirm the problem is in the failure to integrate your PDF using the multi-dimensional adaptive integrator.
Just using the TF2 created with the RooAbsReal::asTF method, if I use the adaptive integrator I get a failing error code and a different result with respect using a simple bin integrator (i.e. binning the function in an histogram). Using VEGAS,
ROOT::Math::IntegratorMultiDimOptions::SetDefaultIntegrator(“VEGAS”),

I get a better result.

Probably MC integration is not very accurate so I am not sure you will be able to use correctly in a fit.
Since your PDF is based on an histogram, I would suggest you to implement the integration in your PDF yourself, using the contained histogram. You should be careful to make it as a function as smooth as possible as function of the parameters, otherwise you might have problem fitting.

Best Regards

Lorenzo

Hi Lorenzo,

thanks for looking into it. It’s a pity things don’t work directly, but I will have a look at your proposed solution.
Can you give me a hint, how I should implement the integration myself?
Should I:
[ul]
[li]add a method for the analytic integral which will automatically be used (I have to make a new skeleton PDF class to see what code is needed)[/li]
[li]call the create histogram method in there and return the integral[/li][/ul]

or, to come back to an earlier question: is there any other way to fit different data sets with different pdfs in different ranges (including a hypothesis test with RooStats).

Hi,

You can do what you want in your implementation of your analyticalIntegral method. You can look for example at the RooGaussian class to see which methods need to be implemented.

I am not sure I have fully understood your second questions. Which other way are you referring too ?
To fit different data sets with different pdf’s the only way is to use a RooSimultaneous or you implement something yourself

Best

Lorenzo

Hi Lorenzo,

I tried to implement the analytic integral as you proposed. But my lack of C++ knowledge makes this difficult :frowning:
The idea was to do this:

  Int_t TestPdf::getAnalyticalIntegral(RooArgSet& allVars, RooArgSet& analVars, const char* /*rangeName*/)
  {
     if (matchArgs(allVars,analVars,x)) {
        pdfhist_x = (*this).createHistogram("x", 100) ;
        return 1 ;
     }
     if (matchArgs(allVars,analVars,x)) {
        pdfhist_y = (*this).createHistogram("y", 100) ;
        return 2 ;
     }
     if (matchArgs(allVars,analVars,x,y)) {
        pdfhist_xy = (*this).createHistogram("x,y", 100, 100) ;
        return 3 ;
     }
     return 0 ;
  }


  Double_t TestPdf::analyticalIntegral(Int_t code, const char* rangeName) const
  {
     assert(code==1 || code==2 || code==3) ;

     Double_t ret = 0;
     if(code==1){
       ret = pdfhist_x->Integral("WIDTH") ;
     } else if(code==2) {
       ret = pdfhist_y->Integral("WIDTH") ;
     } else if(code==3) {
       ret = pdfhist_xy->Integral("WIDTH") ;
     } else {
       cout << "Error in TestPdf::analyticalIntegral" << endl ;
     }
     return ret ;
  }

with the 3 histograms pdfhist_x,_y,_xy defined in the header.
Attached is are the files my attempt to have the analytical integral calculated with the createHistogram() method. However:

  • I cannot compile the code without a warning message ()
  • the analytical integral is not used but instead still the (wrong numerical integral)
    Could you by any chance have a look at the files and help me find the problem. Thank you very much,

Lukas
test_threshold_pdf.py (1.12 KB)
TestPdf.cxx (3.25 KB)
TestPdf.h (1.71 KB)