RooFit binned Likelihood fit not taking into account bin-errors

Dear ROOT and RooFit experts,

I am trying to fit a background shape, which is rapidly falling, and I have a function that I already know it works well.

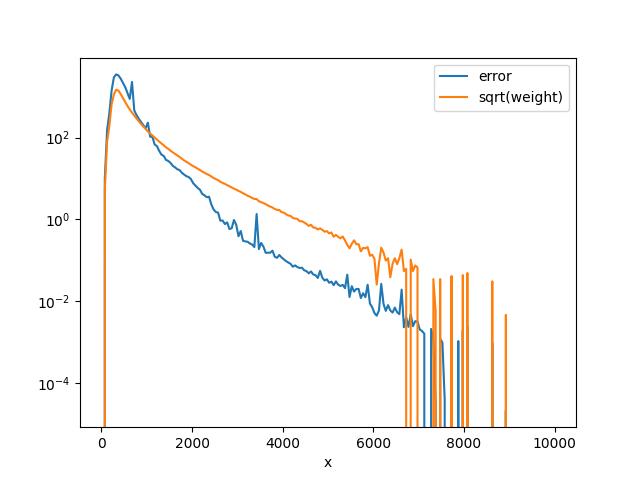
In my analysis I actually need to fit data, but I need to test the function by fitting the simulation (MC). To test the differences that I would see in the case in which I have data, I use the MC and set the error of each bin to sqrt(bin_content). Therefore, I have two MC histograms, both with the same bin content (both in the .root file provided):

  • MC whose bin errors are calculated as the sqrt(sumw2)
  • MC whose bin errors are calculated as the sqrt(bin_content) (hist_name ending with sqrtN_error)

I tried fitting both histograms with the RooAbsPdf::fitTo and RooAbsPdf::chi2FitTo functions. The piece of code to fit with the former method is:

# one of the parameters depends on which error we consider
if args.error_type == 'counts':
    sumw2_error = False
else:
    sumw2_error = True
fit_nll = wksp.pdf(model_name).fitTo(wksp.obj('bkg'), RF.Save(), RF.SumW2Error(sumw2_error), RF.Range('fitrange'))

and the line in which I fit with the chi-square method is:

# none of the parameters depend on the error
fit_chi2 = wksp.pdf(model_name).chi2FitTo(wksp.obj('bkg'), RF.Save(), RF.Range('fitrange'), RF.InitialHesse(True))

Using the Likelihood method I get the exact same result for both MC histograms (red line), meaning that the different errors are not taken into account (at least that is what I think is happening). In contrast, with the chi-square method I get different results for both the MC histograms (blue line). You can see the fits in the two following figures


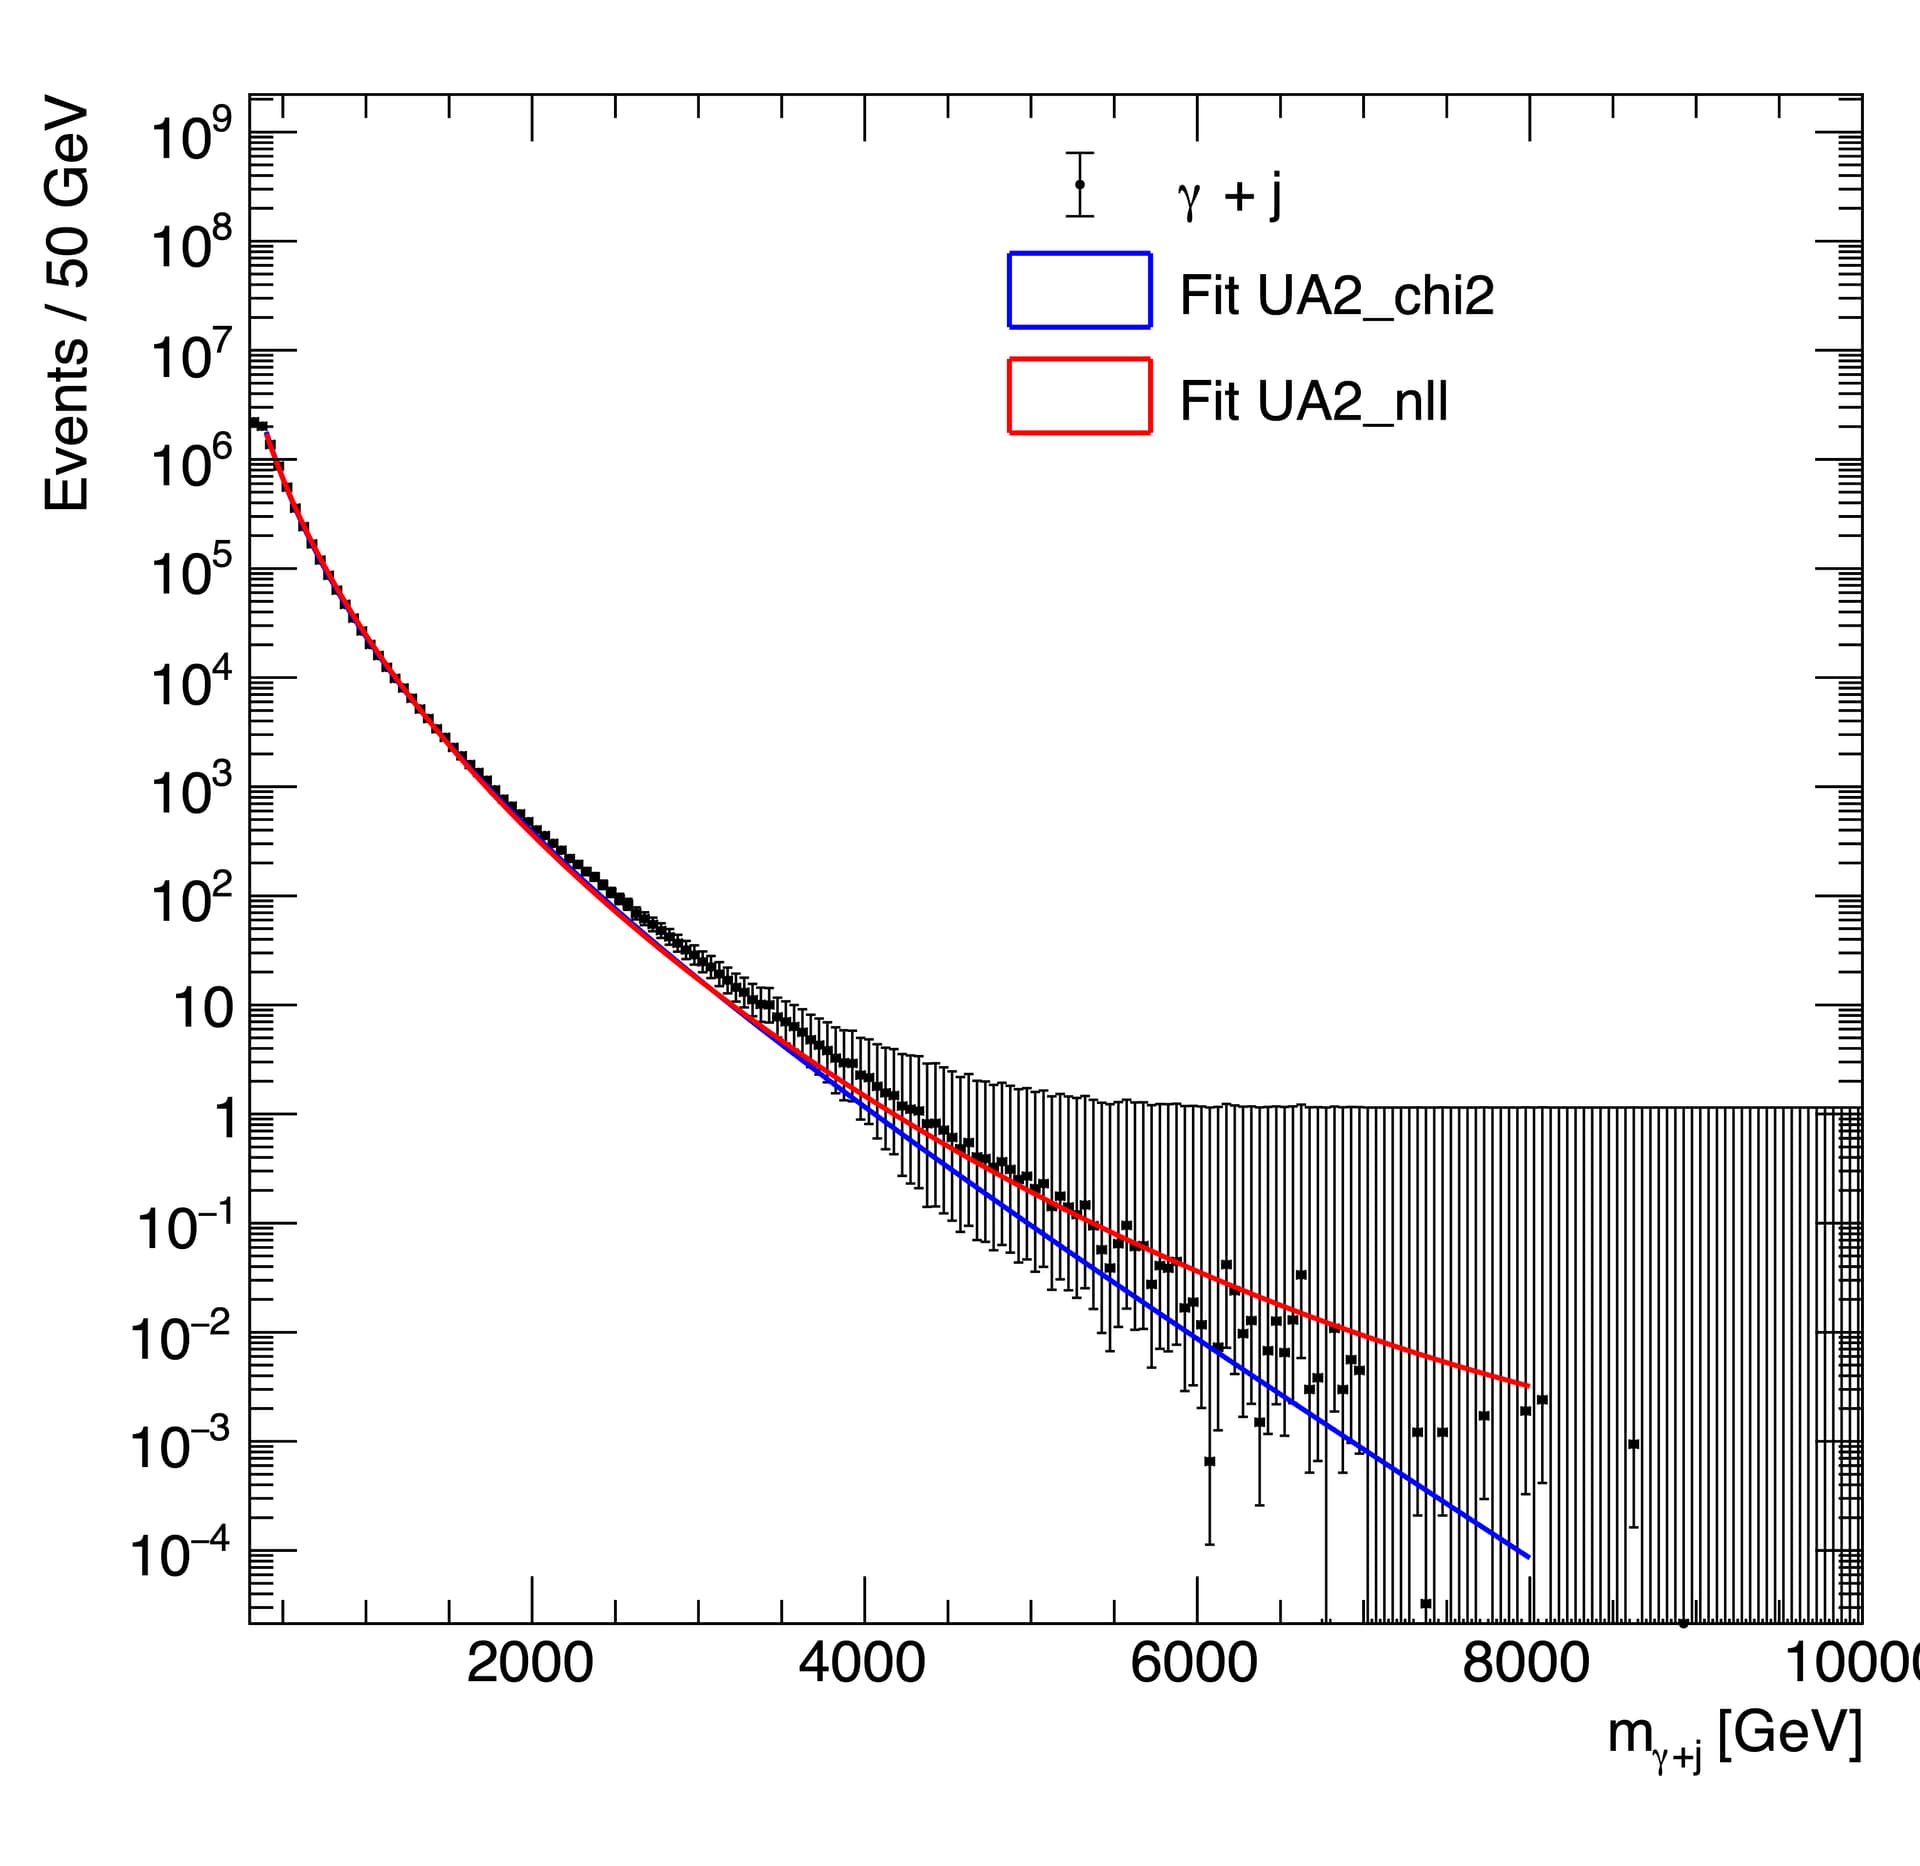
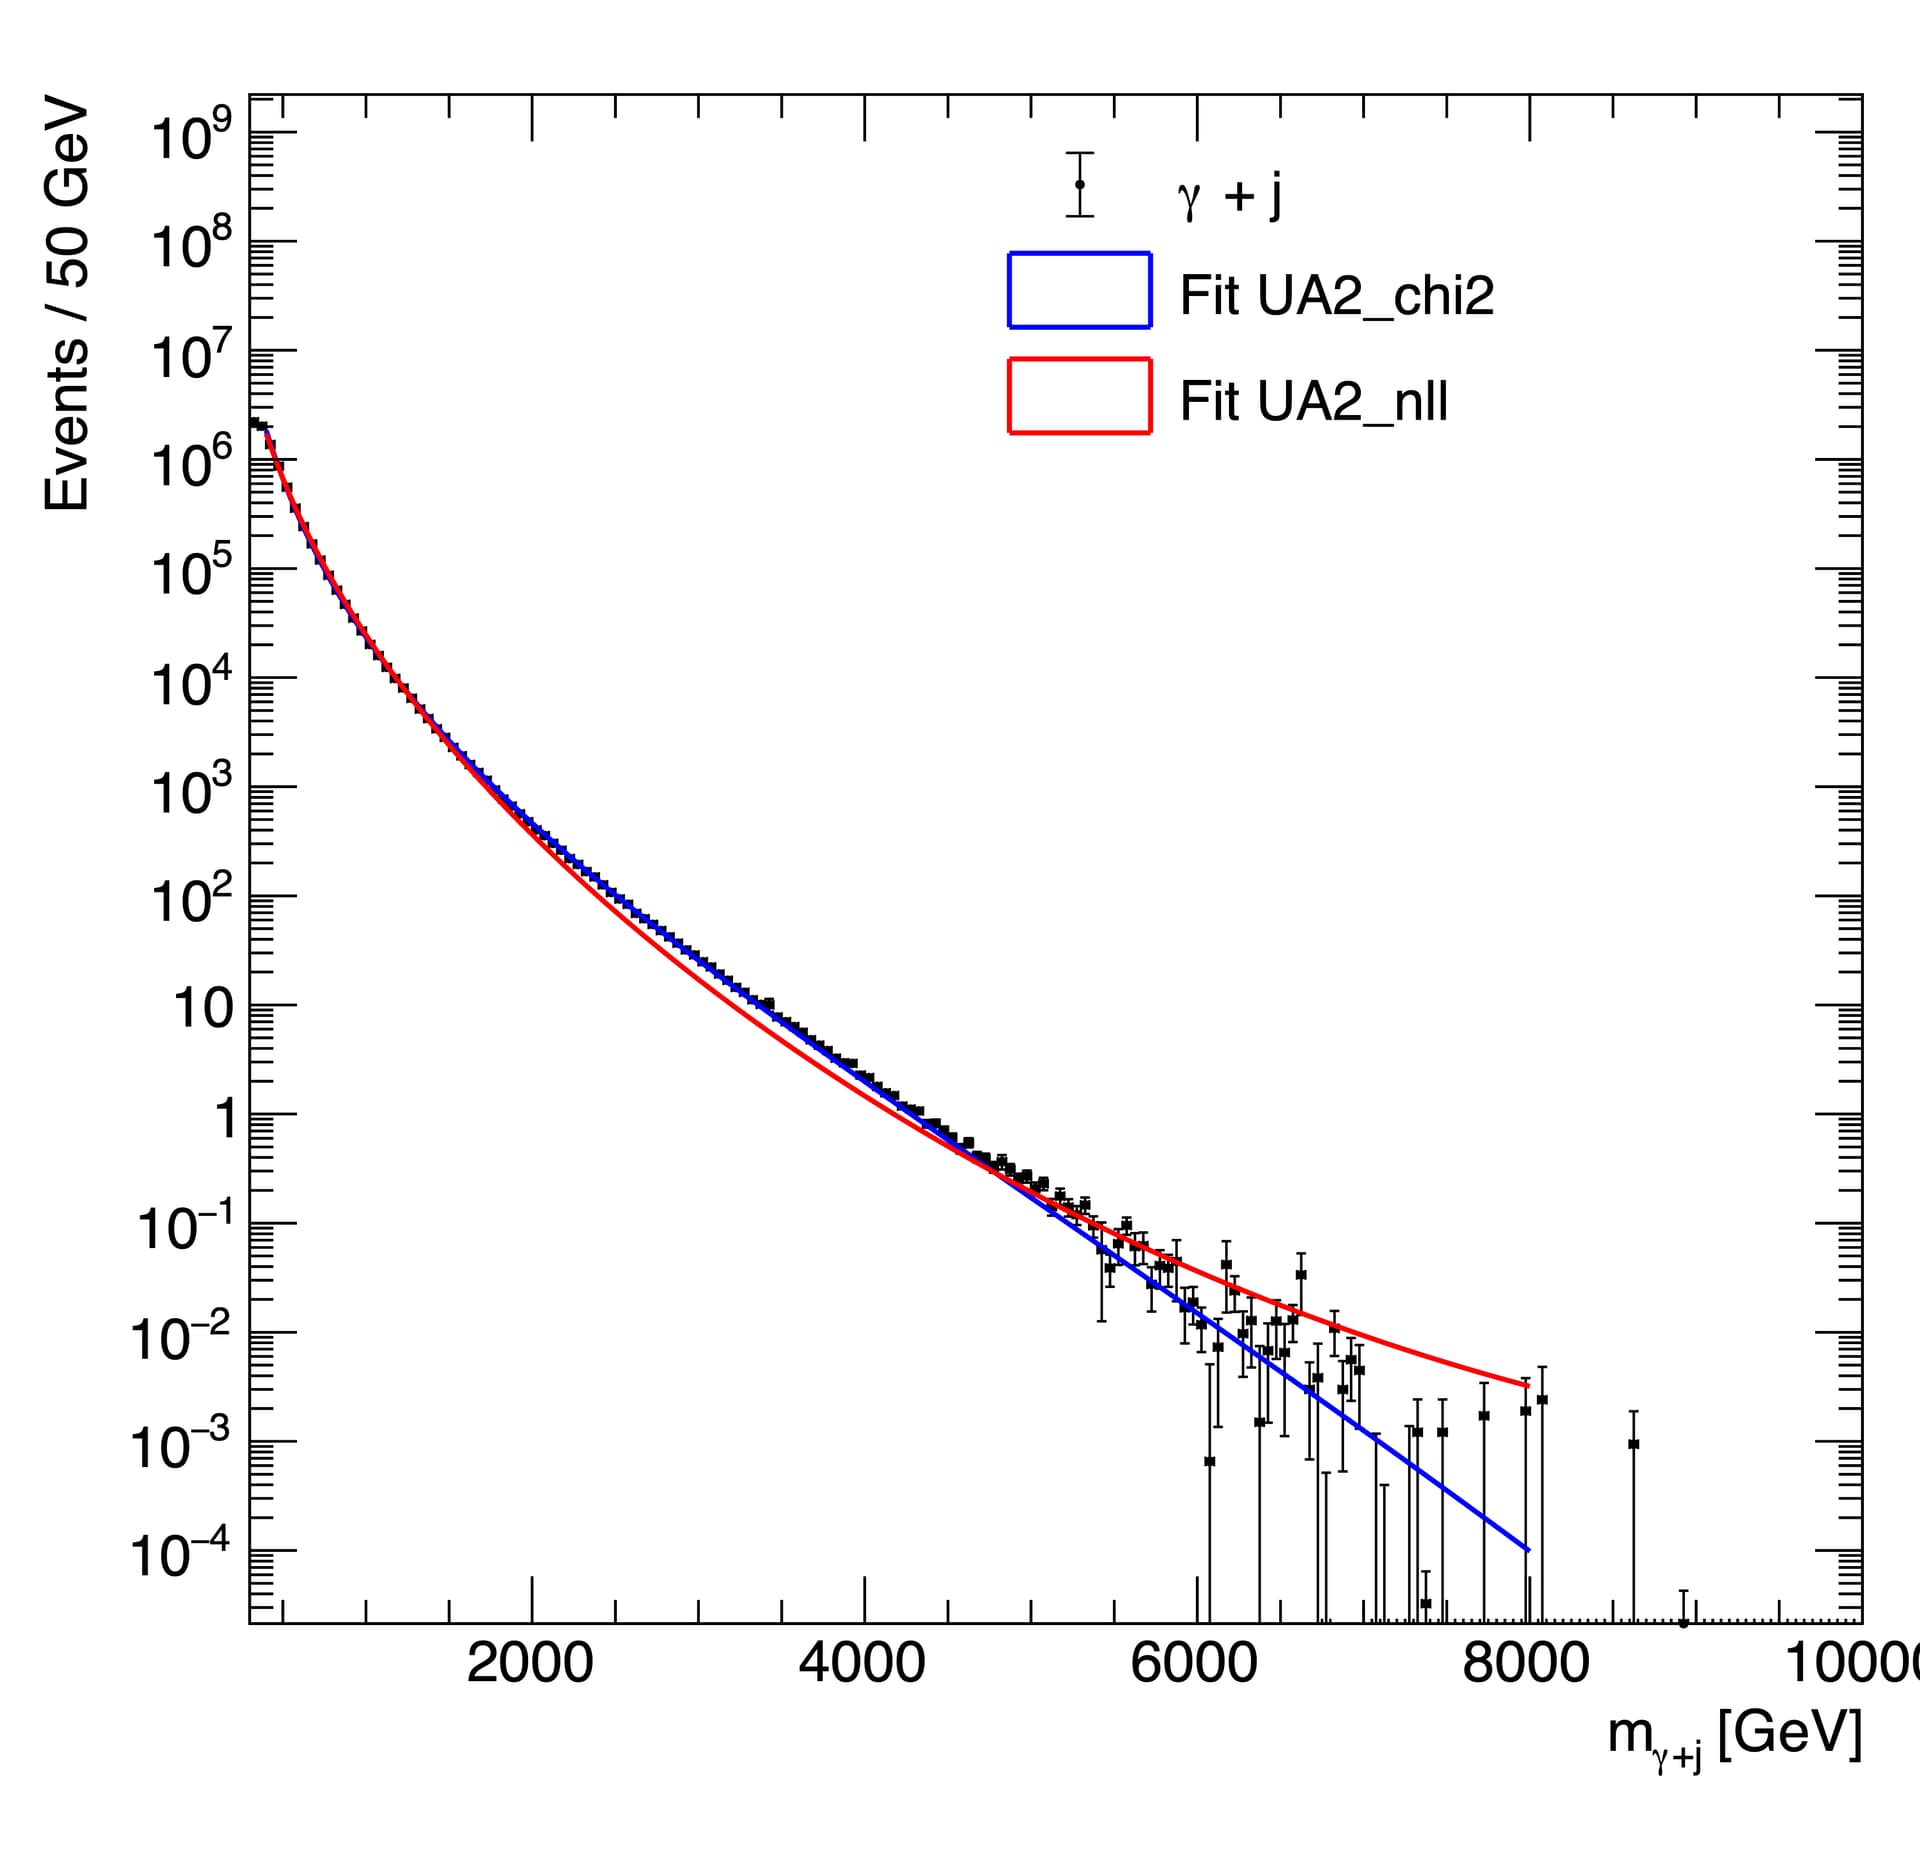
I am not sure how can I tell the fitTo method to use the different interpretation of the errors, or to at least get the bin-error information.

Also, using the chi-square method, I noticed that the chi-square value is too high, even in the case of sumw2 errors, in which we can see that the fit is really good.

fit_properties_sumw2_error = {
     'model_name' : 'UA2_chi2',
     'nvariables' : 4,
     'nbins'      : 152,
     'empty_bins' : 0,
     'ndof'       : 148,
     'chi2'       : 1418.446039459683,
     'chi2_o_ndof': 9.584094861214075,
     'pvalue'     : 3.10655364626651e-206
}

fit_properties_counts_error = {
     'model_name' : 'UA2_chi2',
     'nvariables' : 4,
     'nbins'      : 152,
     'empty_bins' : 0,
     'ndof'       : 148,
     'chi2'       : 1651.1243223589468,
     'chi2_o_ndof': 11.156245421344234,
     'pvalue'     : 5.963149078808809e-252
}

To get the chi-square value I am doing:

chi2_var_sumw2_error = model.createChi2(hist,
                                        RF.Range('fitrange'),
                                        RF.DataError(ROOT.RooAbsData.SumW2))
chi2_var_counts_error = model.createChi2(hist,
                                        RF.Range('fitrange'),
                                        RF.DataError(ROOT.RooAbsData.Poisson))

and then I calculate the ndof by hand.

So, to summarize, I have three questions:

  1. What information should I provide to the fitTo method to consider bin-errors appropriately?
  2. Is the chi2FitTo method use correctly in both cases of bin-errors? I ask this because the function call doesn’t change, only the errors of the input histogram.
  3. What could be happening to the goodness of fit chi-square and p-values for the case of using the least-squares method, in which I see enormous chi-square values?

Any help on this is greatly appreciated :slight_smile:

Thank you very much for your time and patience

Cheers,
Francisco


input_hists.root (184.0 KB)
bkg_fits.py (4.0 KB)
utils.py (16.0 KB)

Hi! I imagine everyone is quite busy and that’s why there’s no answer yet. I’m replying to bring the post up to the top again.
W/hen you have a moment I would be glad if someone could take a look at this :slight_smile:

Thanks a lot
Francisco

Hi @fsili!

Lots of what you observe can be understood when comparing the errors in your two different histograms, here for h__photonjet__Nom__SR__phjet_m in blue and h__photonjet__Nom__SR__phjet_m__sqrtN_error in orange.

weights

Now a few explanations:

  1. A likelihood fit only works mathematically when your histograms represents counts that naturally have Poisson errors. So the bin errors will be ignored and not change the fit result as you observe.

  2. What probably confused you is the SumW2Error() option in the likelihood fitting function RooAbsPdf::fitTo() though. This option has no effect on the nominal parameter values of the fit result. If enabled, it will only scale the uncertainties as if the fit was done on a dataset with a statistical power that would correspond to your bin errors (you can read more on this in the paper linked in the fitTo() docs).

  3. If histogram errors and Poisson errors would have behaved the same differential in the mass, then you could have done a likelihood fit with the SumW2Error() correction because only an overall scaling of the weights has no effect of the fit result anyway (just on the uncertainties, which is considered by the SumW2Error() option). But this is clearly not the case, as you can see in the fit above.

  4. Comparing the bulk and the tail of your distribution, the Poisson errors in the tail are much larger than the histogram errors, and in the builk much smaller. As the likelihood fit is considering the Poisson errors as we established now, it will care much less about fitting the tail than the Chi2 fit. But if you look at the bulk of the distribution, you will see that the NLL fit actually agrees better than the Chi2 fit.

  5. This is also the reason why the chi2 value is so high, even the fit looks good to you by eye. In your logarithmic plot, you see mostly the tail that is forced to be modeled well in the Chi2 fit because your bin errors in the tail are smaller, relatively speaking.

In summary:

  • You can’t do likelihood fits on binned datasets with custom errors that behave differentially different from the Poisson errors
  • Doing a chi2 fit is fine, but depending on whether you use Sumw2 errors or Poisson errors, the fit will either adapt more to the tail (sumW2 errors) or the build (Poisson errors) as you see in your plots, because the differential behavior of these errors is so different (which you can see in my plot).
  • In case you use the Poisson errors, where the NLL fit is valid, the NLL fit actually looks better than the Chi2 fit as expected
  • That means everything makes sense, the only problem is that you model can’t fit the bulk and the tail at the same time, which is also why the chi2/ndf is always high. I would try to improve the model, maybe having different parameters for the bulk and the tail

Sorry for the long text, but maybe it is helpful to you that I put my complete line of thought here!

Cheers,
Jonas

2 Likes

This topic was automatically closed 14 days after the last reply. New replies are no longer allowed.