Hello,
I’ve noticed that RooFFTConvPdf seems to translate PDFs by an amount which is proportional to the range of the fit. Below is a macro which reproduces this:
GaussianBias.C (2.04 KB)
This macro performs the following:
[ul]
- Loops over a set of possible ranges (-range,range)
- Generates a dataset from a Gaussian of mean 0, width sqrt(2)
- Fits this with the RooFFTConvPdf of a Gaussian w/ floating mean, width 1 with another of mean 0, width 1
- Stores the value of the floating mean against the width 2*range of the range
[/ul]
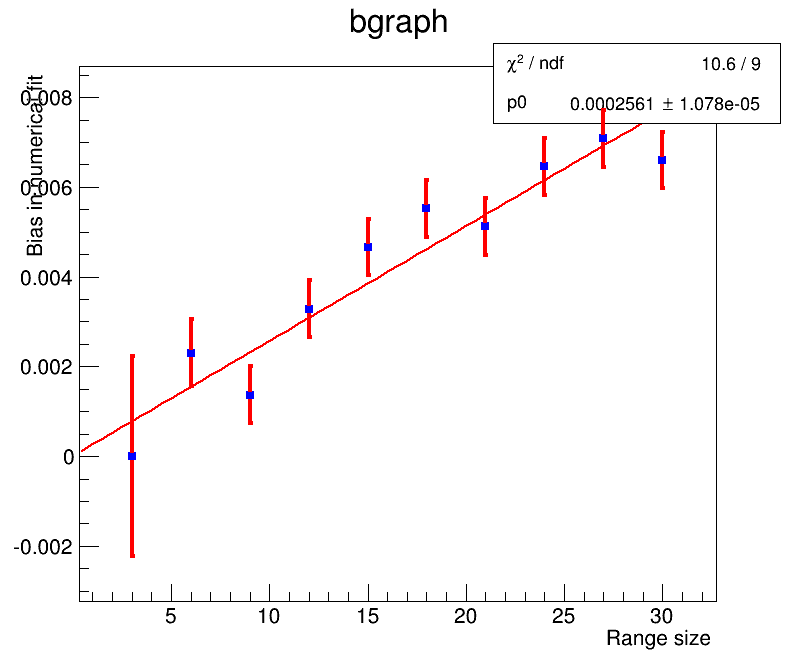
I would expect the fitted value of the floating mean to be 0, but instead it seems to be proportional to the width of the range:
I tried varying the widths, location of mean, and the increasing the number of bins, but none of these seemed to have much of an effect on the bias. As an example, here is the trend with both the widths of all the gaussians doubled:
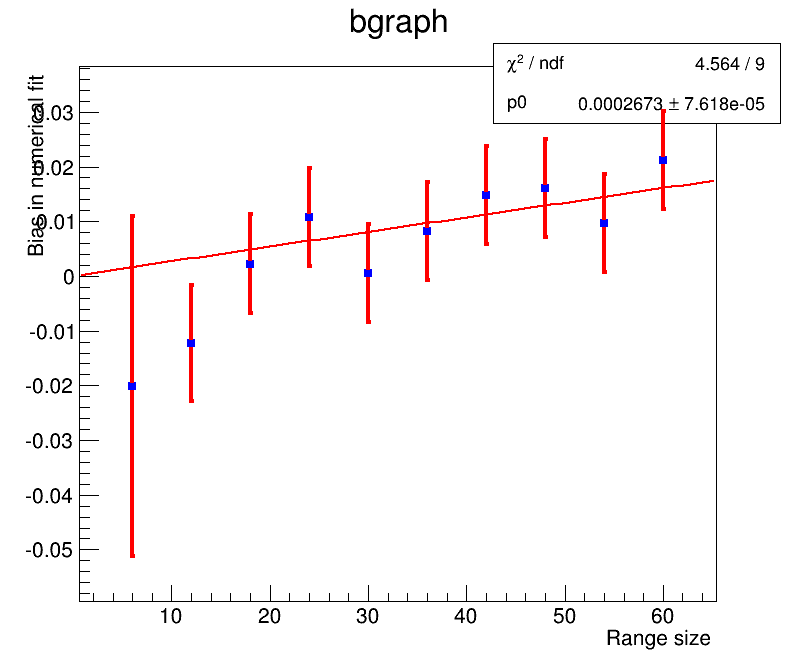
(This was made with lower statistics and a the trendline fit forced to go through (0,0))
Here is a very similar script (and its output), where the two convolved PDFs are a non-relativistic Breit Wigner and a Gaussian (the generating PDF is a Voigtian and the fitting pdf is the numerical convolution):
VoigtianBias.C (1.95 KB)
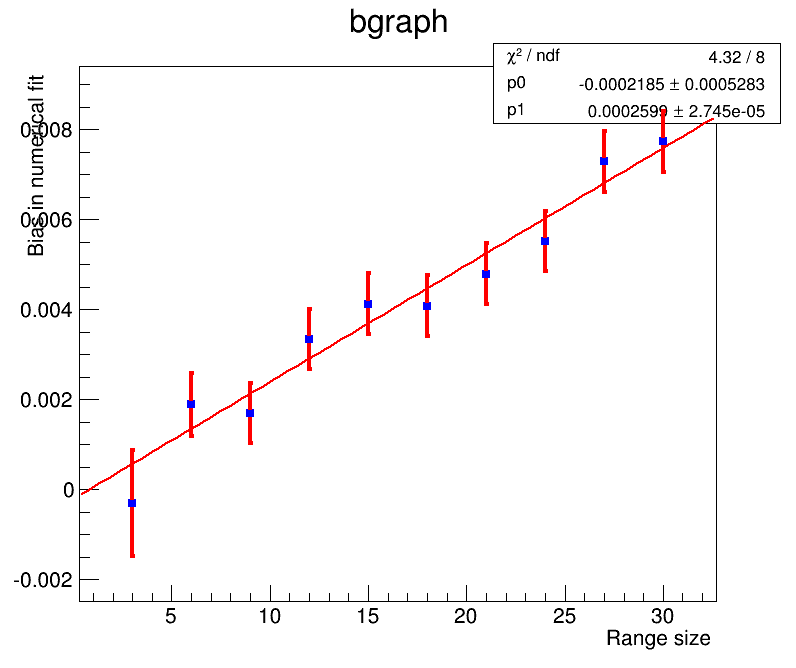
At first glance, it seems like the slopes of the bias trendline for the Gaussian / Breit-Wigner cases agree. However, an earlier version of this script on a different computer had a different slope (in fact, almost exactly twice greater). I will do some archaeology to figure out what changed between that version and the current (it might well have been a bug such as a missing factor of 2 somewhere) before speculating on the universality of this slope.
Does anyone know of the cause of this behavior, and/or a solution?
Cheers,
Jack Wimberley