Dear experts,
When I try to plot a binned data using RooFit, I found a strange thing. I projected my two data set to 1-dimensional histograms with binning of 200 and combined them with using RooCategory as below:
TChain tc1("h2");
TChain tc2("h2");

tc1.Add("./dataset1/*.root");
tc2.Add("./dataset2/*.root");

TH1F* ddd = new TH1F("ddd", "ddd", 200, 0.14, 0.155);
TH1F* dde = new TH1F("dde", "dde", 200, 0.14, 0.155);

tc1.Project("ddd", "dmass0", "dmass0<0.155&&dmass0>0.14");
tc2.Project("dde", "dmass0", "dmass0<0.155&&dmass0>0.14");

RooRealVar x("x","x",0.14,0.155) ;

RooDataHist data("data", "data", x, ddd);
RooDataHist data_ctl("data_ctl", "data_ctl", x, dde);

RooCategory sample("sample","") ;
sample.defineType("physics") ;
sample.defineType("control") ;

RooDataHist combData("combData","combined data",x,Index(sample),Import("physics",data),Import("control",data_ctl);
And I tried to plot “physics” histogram by using
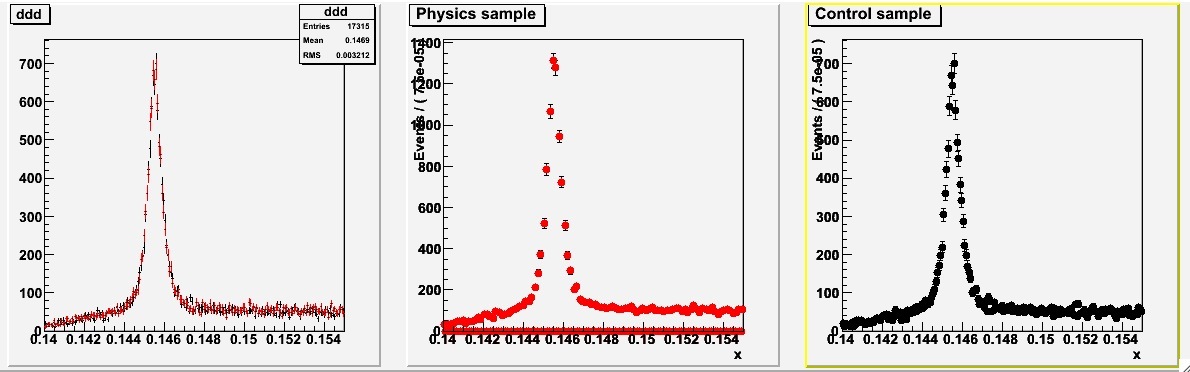
combData.plotOn(frame1,Binning(200),Cut("sample==sample::physics"));But the plot looks weird as shown in the attachment. (The plot shows using TH1F::Draw, combData.plotOn, and data.plotOn, respectively) Apparently the second one is wrong. In principle, the second one and the third one should be the same, I guess.
I tried to change number of bins by varying Binning() in combData.plotOn but it seems there is a limit of 100 bins. So extra 100 bins are regarded as empty ones.
I have no idea how I can draw 100+ bins with using RooCategory. Could you help me?