Hello experts,
I’m having trouble with importing TH1D histograms with variable binning into a RooDataHist and then performing a fit and plotting the result. This issue has been brought up in the past (here, last comment in 2019) and the result seemed inconclusive. There were some suggestions of making the RooDataHist with the Import(TH1 *, kFALSE) option and the plotOn() using DataError(RooAbsData::SumW2) option. Here is my root code demonstrating the setup.
//Prepare file to fit to
TFile * f1 = new TFile("SigRho_10-90FullExtractedYieldMap.root");
TH2F * sigrhoYieldHist = (TH2F * ) f1 -> Get("yieldHist");
TH1D * sigrho1DYieldHist = sigrhoYieldHist -> ProjectionY("sigrho1DYieldHist", 1, 10);
double TotalSize = sigrho1DYieldHist -> GetEntries();
RooRealVar mpipi0("InvM_pipi0", "M_{#pi#pi^{0}}", 0.25, 3.5);
RooDataHist * dataHist = new RooDataHist("dataHist", "dataHist", mpipi0, Import(* sigrho1DYieldHist, kFALSE));
//Prepare PDF to fit
TFile * f2 = new TFile("Sig_Mpipi0WeightedPDF.root");
TFile * f3 = new TFile("Rho_Mpipi0WeightedPDF.root");
RooWorkspace * sigWorkspace = (RooWorkspace *) f2 -> Get("myWorkspace");
RooWorkspace * rhoWorkspace = (RooWorkspace *) f3 -> Get("myWorkspace");
RooAbsPdf * sigMpipi0Pdf = sigWorkspace -> pdf("sigPDF");
RooAbsPdf * rhoMpipi0Pdf = rhoWorkspace -> pdf("rhoPDF");
double sigMean = sigFrac*TotalSize*0.01;
double rhoMean = rhoFrac*TotalSize*0.01;
RooRealVar nSig("nSig", "Number of signal events", sigMean, 0.9*sigMean, 1.1*sigMean);
RooRealVar nRho("nRho", "Number of D rho events", rhoMean, 0.9*rhoMean, 1.1*rhoMean);
RooExtendPdf * sigExtended = new RooExtendPdf("sigExtended", "sigExtended", * sigMpipi0Pdf, nSig);
RooExtendPdf * rhoExtended = new RooExtendPdf("rhoExtended", "rhoExtended", * rhoMpipi0Pdf, nRho);
RooAddPdf * totalPdf = new RooAddPdf("totalPdf", "totalPdf", RooArgSet(* sigExtended, * rhoExtended), RooArgSet(nSig, nRho));
//Do the fit
RooFitResult * fitRes = totalPdf -> fitTo( * dataHist, Extended(kTRUE), SumW2Error(kTRUE), NumCPU(16), PrintLevel(1), Save());
//Plot the full result
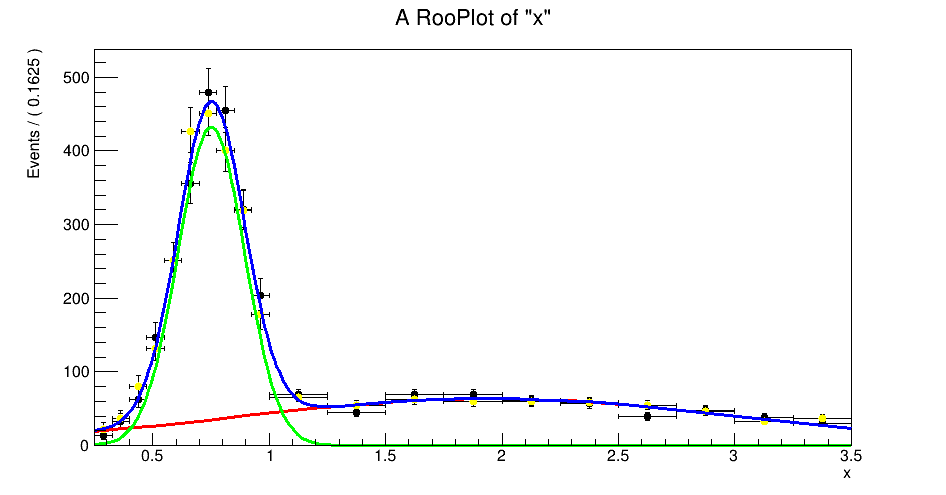
RooPlot * range = mpipi0.frame(Name("range"), Title("Mixed Sample"));
dataHist -> plotOn(range, MarkerColor(kBlack), Name("data"), DataError(RooAbsData::SumW2));
totalPdf -> plotOn(range, Components("sigPDF"), LineColor(kRed), Name("D #pi #pi^{0}"));
totalPdf -> plotOn(range, Components("rhoPDF"), LineColor(kGreen), Name("D #rho"));
totalPdf -> plotOn(range, LineColor(kBlue), Name("model"));
range -> Draw();
The fitter doesn’t complain and does converge on a value for nSig and nRho, but the resulting plot is clearly not correct and exhibits some weird plotting behaviour around 0.75:
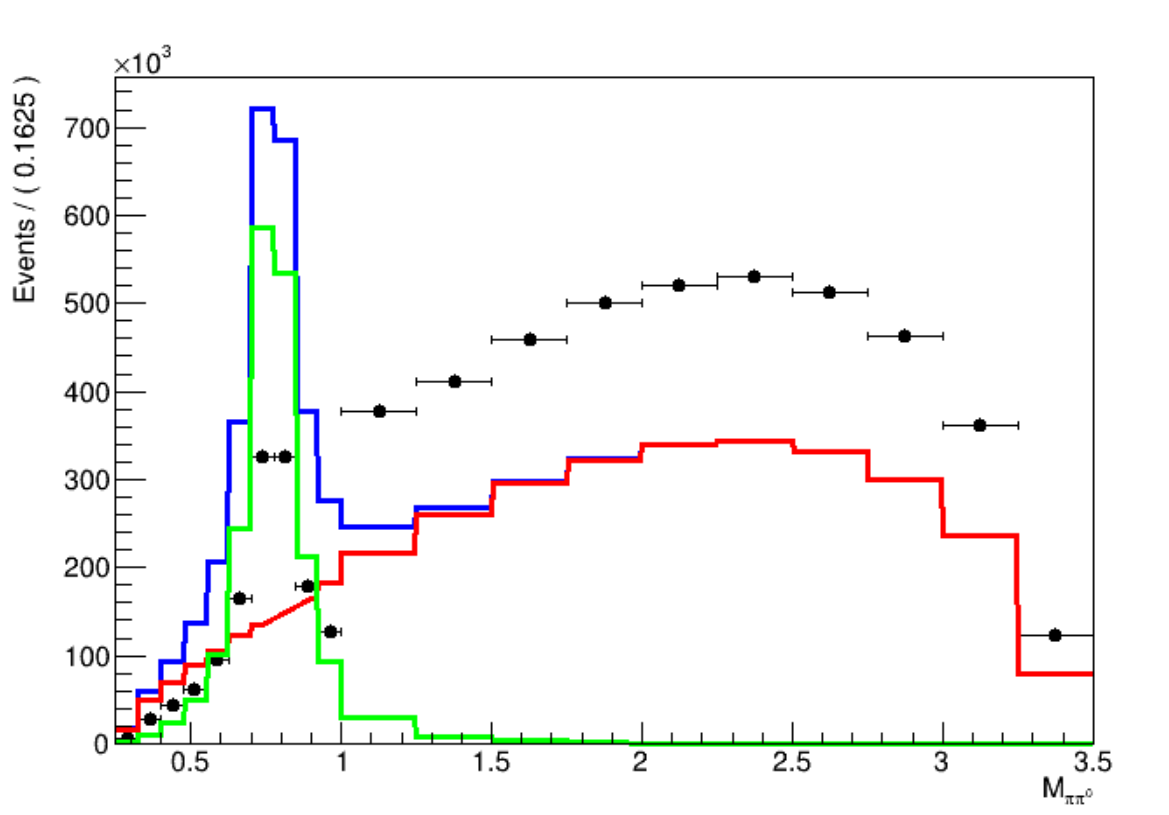
Have I done something wrong or is there some known workaround for this?
Thanks,
Kim
ROOT Version: 6.24
Platform: Red Hat Enterprise Linux 7.9
Compiler: GCC 10.2.0
 Your histogram represents yields, not probability densities, so indeed using