Dear RooFit experts,
I am trying to plot a combination of a RooHistPdf and a simple PDF created with RooFit. I am doing so since in my original problem it is difficult to model one process with a function, and when combining with other processes the fits are not converging properly or give weird results.
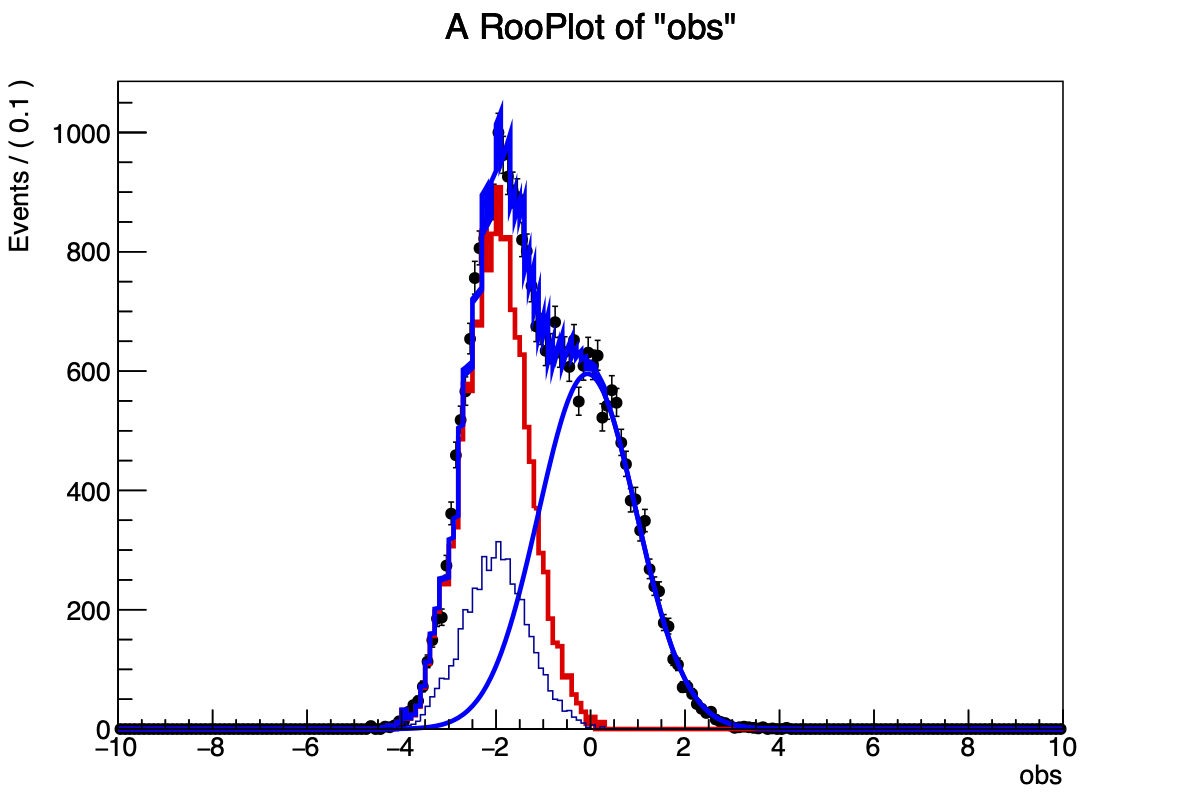
So I create the template histogram, the data histogram, and finally the PDF that is going the be combined with the template histogram. I fit, everything is successfull, but when plotting I find the resulting RooAddPdf in the ‘range’ of where the template histogram is, shaped as a combination of a histogram and PDF. Is it possible to avoid this? Either by making the combined PDF look like a histogram evaluated at each bin, or by making the RooAddPdf visualization look smooth? Preferably I would like the latter option.
Here I leave a MWE:
import ROOT

# Create a ROOT histogram for the template
datahist     = ROOT.TH1F("data", "Data", 200, -10, 10)
templatehist = ROOT.TH1F("template", "template", 200, -10, 10)

# Fill the template histogram with Gaussian-distributed random numbers
random = ROOT.TRandom3(0)
for i in range(15000):
    value1 = random.Gaus(0, 1)
    value2 = random.Gaus(-2, 0.7)
    datahist.Fill(value1)
    datahist.Fill(value2)

for i in range(5000):
    value2 = random.Gaus(-2, 0.7)
    templatehist.Fill(value2)


c1 = ROOT.TCanvas("c1", "hists", 800, 600)
datahist.Draw('hist')
templatehist.Draw('hist same')
# canvas.SaveAs("two_gaussian_fit.pdf")

integral_data     = datahist.Integral()
integral_template = templatehist.Integral()


# Create a RooFit workspace
x = ROOT.RooRealVar("obs", "obs", 0, -10., 10.)

# Create RooFit variables for the mean and width of the Gaussian
mean  = ROOT.RooRealVar("mean", "Mean"  , 0, -10, 10)
width = ROOT.RooRealVar("width", "Width", 1., 0, 10)

# Create a RooFit Gaussian model
gaussian = ROOT.RooGaussian("gaussian", "Gaussian", x, mean, width)


yield_gaussian = ROOT.RooRealVar("yield_gaus"    , "yield_gaus"    , integral_data-integral_template, 0., 1.5*integral_data)
yield_template = ROOT.RooRealVar("yield_template", "yield_template", integral_template, 0., 1.5*integral_data)


# Convert the ROOT histograms to RooFit datasets
roo_templatehist = ROOT.RooDataHist("template_data", "Template Data", ROOT.RooArgList(x), templatehist)
data             = ROOT.RooDataHist("data", "Data", ROOT.RooArgList(x), datahist)

# Create a RooFit template histogram PDF
template_pdf    = ROOT.RooHistPdf("template_pdf", "Template PDF", ROOT.RooArgSet(x), roo_templatehist, 0)

# Combine the template and Gaussian PDFs using RooFit coefficient variables
model = ROOT.RooAddPdf("model", "Model", ROOT.RooArgList(gaussian, template_pdf), ROOT.RooArgList(yield_gaussian, yield_template))

# Fit the data histogram with the combined model
fit_result = model.fitTo(data, ROOT.RooFit.Save(), ROOT.RooFit.Extended(True))

# Plot the fitted model and the data histogram
frame = x.frame()
# template_pdf.plotOn(frame)
data.plotOn(frame)
model.plotOn(frame, ROOT.RooFit.Components('template_pdf'), ROOT.RooFit.LineColor(ROOT.kRed))
model.plotOn(frame, ROOT.RooFit.Components('gaussian'), ROOT.RooFit.LineColor(ROOT.kBlue))
model.plotOn(frame)
frame.addTH1(templatehist, 'hist same')

# Create a canvas and draw the data histogram and fitted model
canvas = ROOT.TCanvas("canvas", "Gaussian Fit", 800, 600)
frame.Draw()
canvas.SaveAs("two_gaussian_fit.pdf")

fit_result.Print()

chi2_ndof = frame.chiSquare(4)

print(f'{integral_data     = }')
print(f'{integral_template = }')
print(f'{integral_template = }')
print(f'chi2 = {chi2_ndof*4.}')
print(f'ndof = {4}')
print(f'chi2/ndof = {chi2_ndof}')
Thank you very much!
Cheers,
Francisco