I have an events in RooDataSet and I have a table of weights in bins of one of variables (TH1D histogram with momentum of a particle on X axis and desired weight of events with such momentum as a bin content)
So I wonder, is it any way to reweigh my events in RooDataSet in bins of a table?
By this moment, the only way I found to reweigh events in RooDataSet is to add a column with weight usind this code:
...
  // Construct formula to calculate (fake) weight for events
  RooFormulaVar wFunc("w","event weight","(x*x+10)",x) ;

  // Add column with variable w to previously generated dataset
  RooRealVar* w = (RooRealVar*) data->addColumn(wFunc) ;
...
But the key difference is that I have to use my own formula which return weight according to value, looking for it in my table. But I’m not sure that it is posible.
Are there any other ways to reweigh events in RooDataSet using external table of weights?
I do not know if you solved this issue. But I have written a simple macro which takes a TH1 as input and provides you a RooAbsReal. If you use it don’t forget to compile using root -l RooTH1Var.cxx+
In practice, you should write something like this:
RooRealVar p(“p”,“momentum along x”, 0, 10000);// set the values you need
RooTH1Var HistVar(“HistVar”,“weight of events with momentum p”, weightHist, p);
Here, the object weightHist is your TH1 of weight.
This simple code could be of course improved by adding some functionnalities.
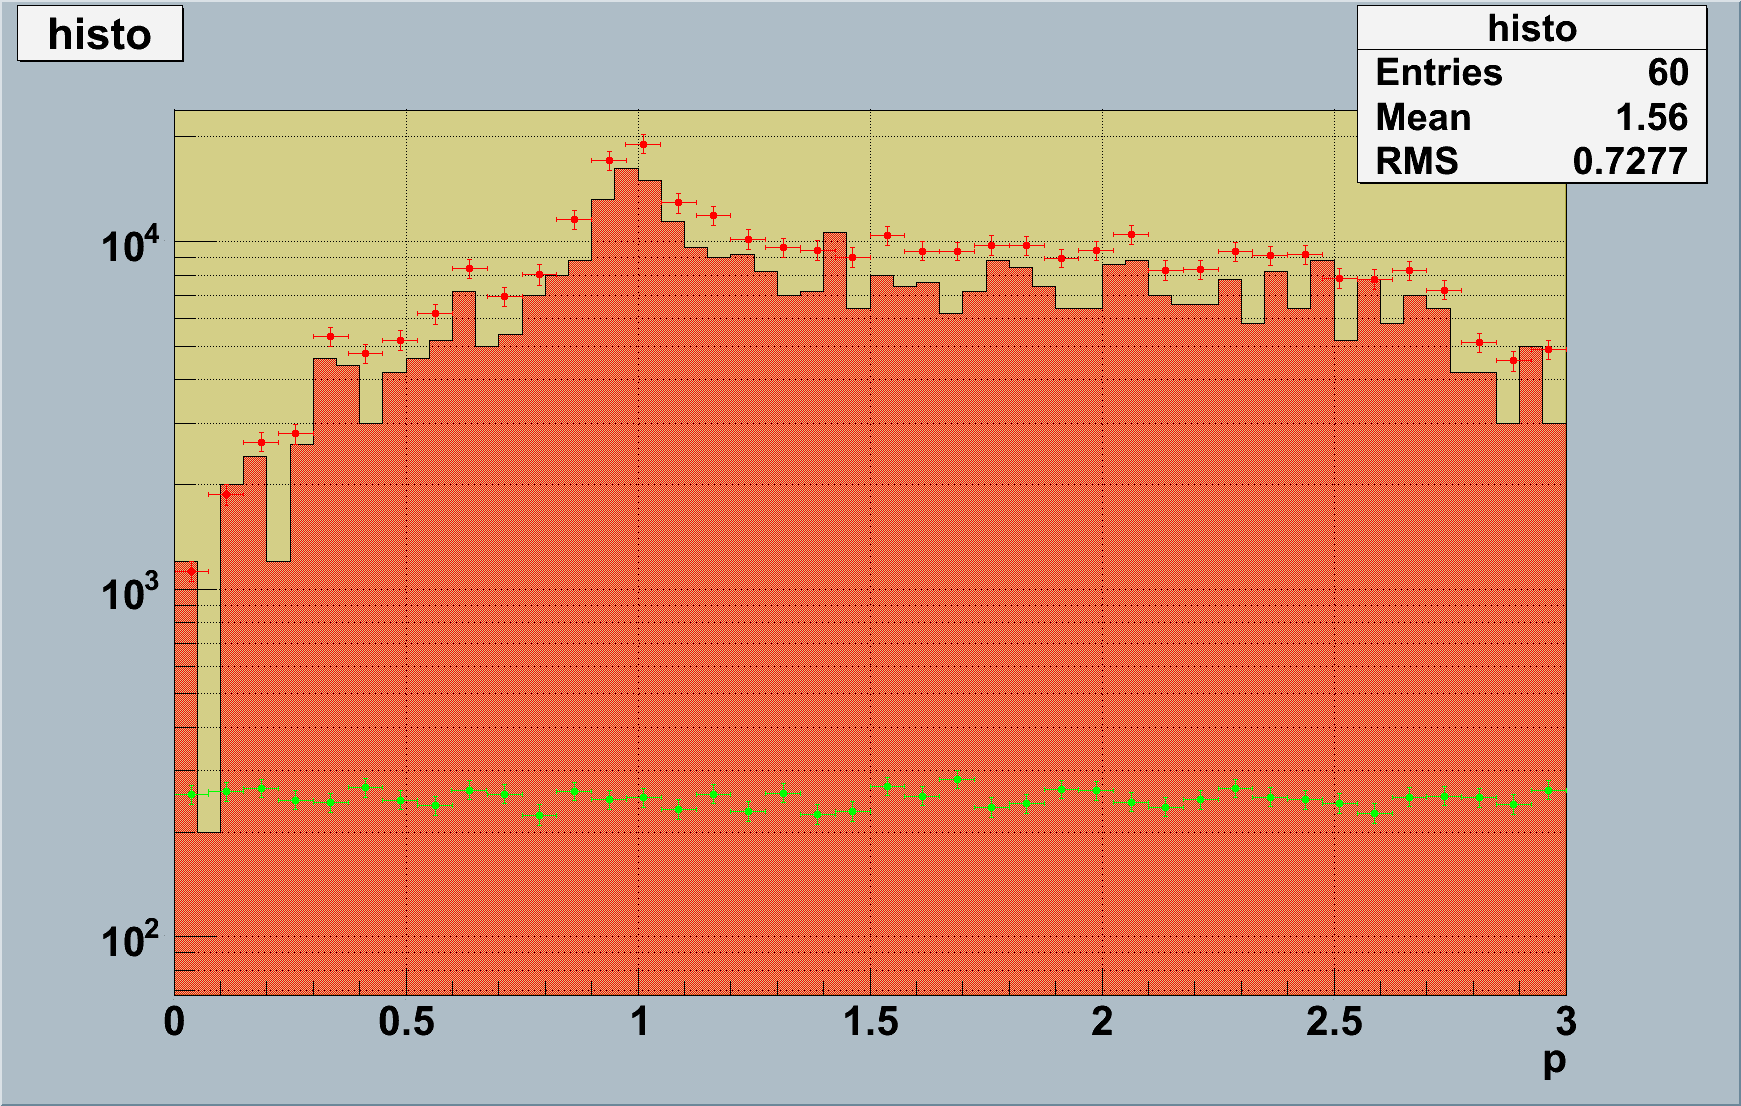
An example is shown on the plot where the blue solid line represent the RooTH1Var constructed from the histogram in red.
It actually seems to work fine. If you use the script in attachment you get the corresponding plot where the red histogram is the weight histogram. The green dots are uniformely distributed generated data and the red one are weighted green dots with the weight histogram. (the y axis is in log scale).