The ticks should be outside the graphs and the labels are shifted accordingly. Furthermore, I need no titles.
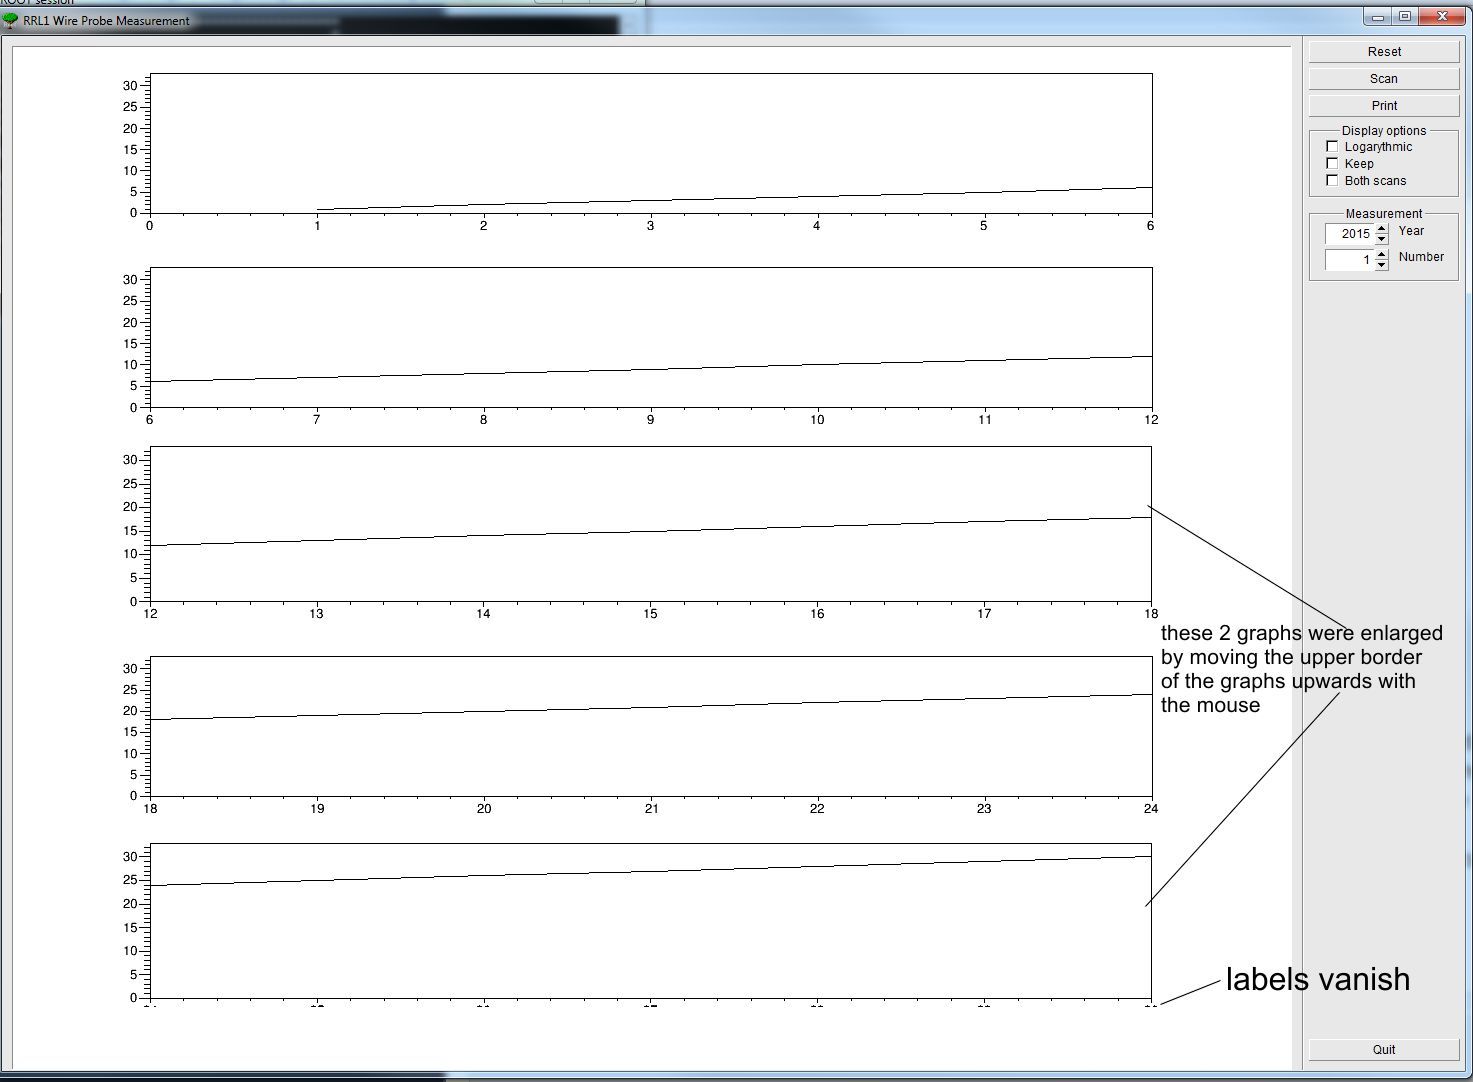
Since I don’t have any titles on top of my graphs I could use that space for vertically increasing my graphs within the pads. Is there a way I can do that? Actually, I can enlarge the graphs inside the pads with the mouse.
Another problem is the lable offset of the last pad. Since I move my labels down they are cut off in parts.
The system is win7 and root 5.34/32
Thanks for help.
Thanks for the link and the links within the links.
Though, these links deal with some many different things that I couldn’t find a solution to my problems. I tried to set border and margins of pads but still the labels of my lower plot are cut off.
What I didn’t find at all is how to stretch my graphs inside the pads. With the mouse I can adjust the size and position within the pads so it fits well. Isn’t there a way to do this in the script?
Thanks, but the graphs inside the pads are still the same. I can increase them vertically with the mouse but I still didn’t find a way to give them a fixed size right from the beginning.
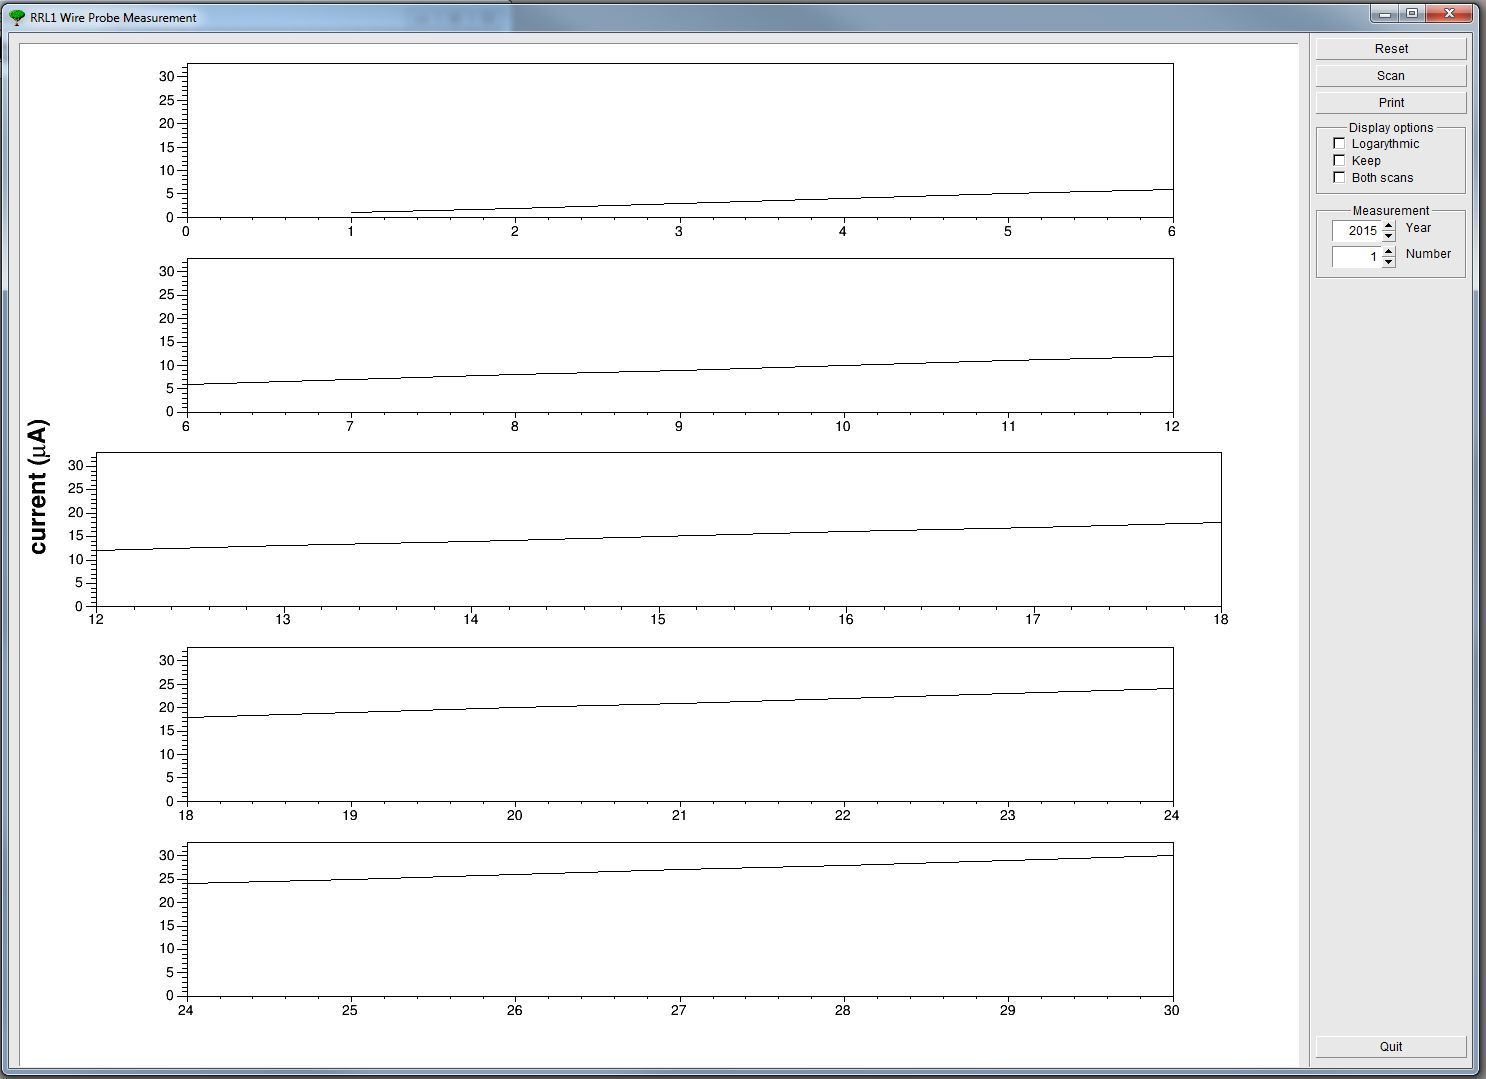
Below I attached a picture how I want my graphs to apear on the canvas or pads. The middle one is the one how it should look like. I resized it with the mouse.
I must admit I have not looked closely (busy with some other matters), and, as you seemed to have found a solution (looking fine for me) I did not investigate further…