Hii ,
Dummy text file :
Energy     Sigma   Sigmaerror

439           1.4           .14
450           1.2            .04
583           1.4            .05
610            1.4            .04
1730         1.5             .09
1765         1.6            .04
2050         1.9             .13
2205         1.9            .08
2614         1.9             .05
2904         1.9             .07
4082          2.6            .17
5551         3.7               .19
6475          4.01           .27
6986         3.99            .24
I fitted this using a0+a1x+a2 x**2 where x is energy
Thanking you,
Saradindu
couet
November 18, 2021, 12:41pm
2
I guess @moneta can help.
Hello ,
Int_t n=100;
Float_t x1,ex1,y1,ey1;
Int_t i=0;
Float_t x[100],ex[100],y[100],ey[100];
while(1){
        ncols=fscanf(fp,"%f %f %f",&x1,&y1,&ey1);
        if (ncols<0) break;
        x[i]=x1;
//        ex[i]=ex1;
        y[i]=y1;
        ey[i]=ey1;
//        cout<<x[i]<<"\t"<<ex[i]<<"\t"<<y[i]<<"\t"<<ey[i]<<endl;
        cout<<x1<<"\t"<<ex1<<"\t"<<y1<<"\t"<<ey1<<endl;
        i++;
        nlines++;
        }
cout<<"found"<<nlines<<endl;
fclose(fp);

TGraphErrors*gr=new TGraphErrors(nlines,x,y,ex,ey);
TCanvas*c1=new TCanvas("c1","graph",100,10,900,600);
c1->SetFillColor(0);

gr->SetMaximum(6);
gr->SetMinimum(0);

gr->SetMarkerStyle(21);
gr->SetLineColor(1);
gr->SetTitle(" Sigma vs Energy Graph");
gr->SetMarkerSize(1);
gr->GetXaxis()->CenterTitle();
gr->GetYaxis()->CenterTitle();
gr->GetYaxis()->SetTitle(" Sigma (keV)");
gr->GetXaxis()->SetTitle(" Energy (keV)");
gr->Draw("AP");
return c1;
}
Thanks
moneta
November 18, 2021, 3:13pm
4
Hi,
Cheers
Lorenzo
couet
November 18, 2021, 3:17pm
5
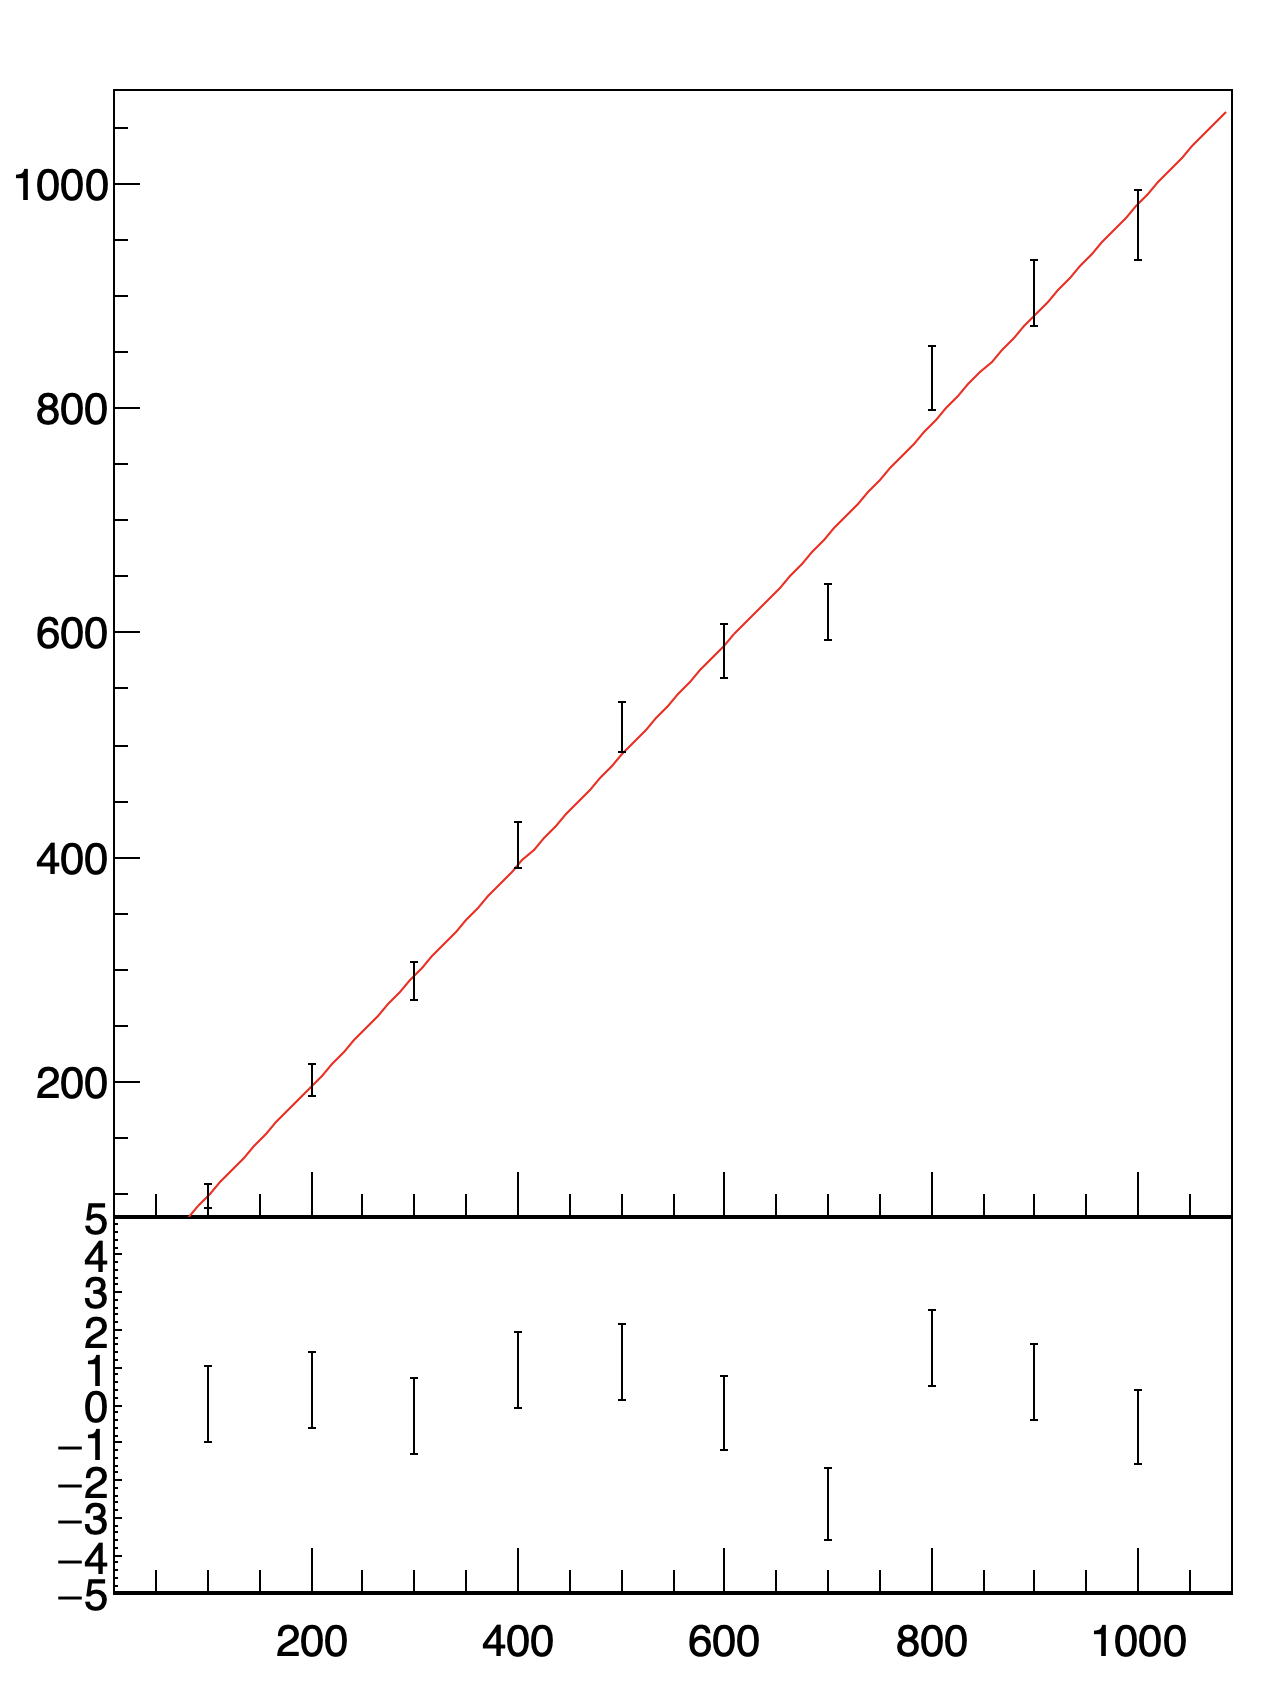
I think I have one ready:
{
  TRandom* rand = new TRandom;

  TGraphErrors* gra = new TGraphErrors;
  for(Int_t i = 1; i <= 10; i++){
    Double_t x = i*100;
    Double_t y = rand->Gaus(x, TMath::Sqrt(x));
    gra->SetPoint(i - 1, x, y);
    gra->SetPointError(i - 1, 0, TMath::Sqrt(y));
  } // i

  TCanvas* can = new TCanvas("can");
  can->SetBottomMargin(0.3);
  //  gra->Draw("ape");
  TF1* f1 = new TF1("f1", "[0]*x");
  gra->Fit(f1);
  gra->Draw("ape");
  f1->Draw("l same");

  TPad* pad = new TPad("pad", "pad", 0., 0., 1., 1.);
  pad->SetTopMargin(0.7);
  pad->Draw();
  pad->SetFillStyle(0);
  pad->cd();

  TGraphErrors* residual = new TGraphErrors;
  for(Int_t i = 1; i <= 10; i++){
    Double_t x = i*100;
    Double_t y0 = f1->Eval(x);
    Double_t y = (gra->GetY()[i - 1] - y0)/TMath::Sqrt(y0);
    Double_t ey = gra->GetErrorY(i - 1)/TMath::Sqrt(y0);
    residual->SetPoint(i - 1, x, y);
    residual->SetPointError(i - 1, 0, ey);
  } // i

  residual->GetHistogram()->SetMaximum(5);
  residual->GetHistogram()->SetMinimum(-5);
  residual->Draw("ape");
}
Thank you very much . I am able to do it for histogram .
If you put one example using graph it will be very much helpful .
Regards
Thank you very much .
regards