I have a naive question. Lets say I have two histograms with respect to number of events observed. For one histogram I have 50K data point and for the second one I have 20K data point. Now I don’t want to normalize with h->Scale(1/h->Integral()); rather I want to change the scale so that I can compare both the histogram as if both the histograms have same number of data point. Is there a way to do so ?
Second question:
Now, consider I have 3 histograms, with first, second and third has 50k, 20k, 5k data points respectively.
for the third one it has (5/20) 1/4 th fraction of data points with respect to second histogram. Now , how could I rescale the third and second histogram so that, I can compare the three histogram, where first and second will have same number of data points and thrid one will have 1/4th of data points with respect to the new rescaled second histogram.
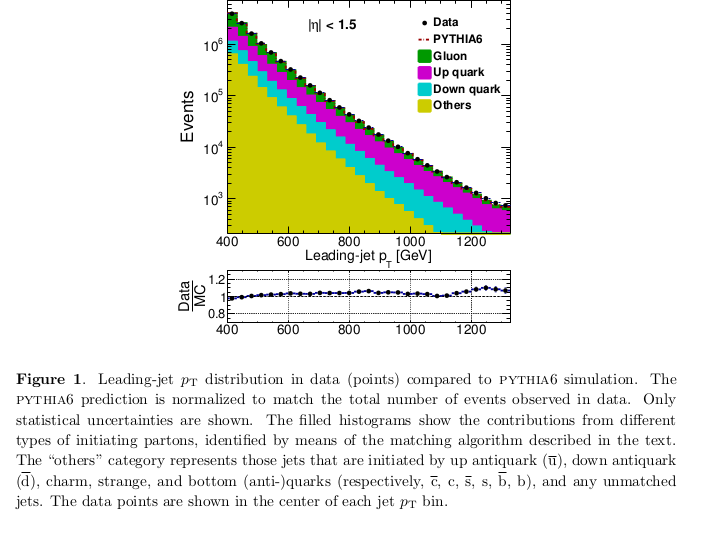
I would like to have something like this below picture.
I think normalizing is the way to go (for instance as presented in this example).
To help you further you might post the histograms so we can understand better what you want to achieve.
I don’t know if this helps or not. This is the solution as far as I have understood the question. As @couet mentioned a macro file or root file will help us understand question even better.
Looks like it worked indeed.
I am posting the example macro scale.C to illustrate the matter I am trying to do. Please check and let me know is my understanding correct or not.
You can generate the plots just by executing the macro.
scale_v1.pdf - RAW distribution (histogram) I have that I want to use as input.
scale_v2.pdf - Normalized histogram with respect to area.
scale_v3.pdf - This is the thing I needed. Here I have use h->Scale(1/h->GetMaximum()) to normalize the histograms. I wanted that histogram2 is normalized with respect to data points observed in histogram1. And normalize the histogram3, keeping that the fraction of events between histogram2 and histogram3 remains same before and after the normalization.
Histogram1 & Histogram2 can be considered Data and MC, respectively. So, they should match after rescalling or normalization.
Histogram3 is a part of Histogram2 . So, after normalization or rescaling Histogram1 & Histogram2 should match, and Histogram3 will be less than Histogram1 or Histogram2.
Also if I add Histogram4 which also a part of Histogram2 , should match the criteria of point 2.