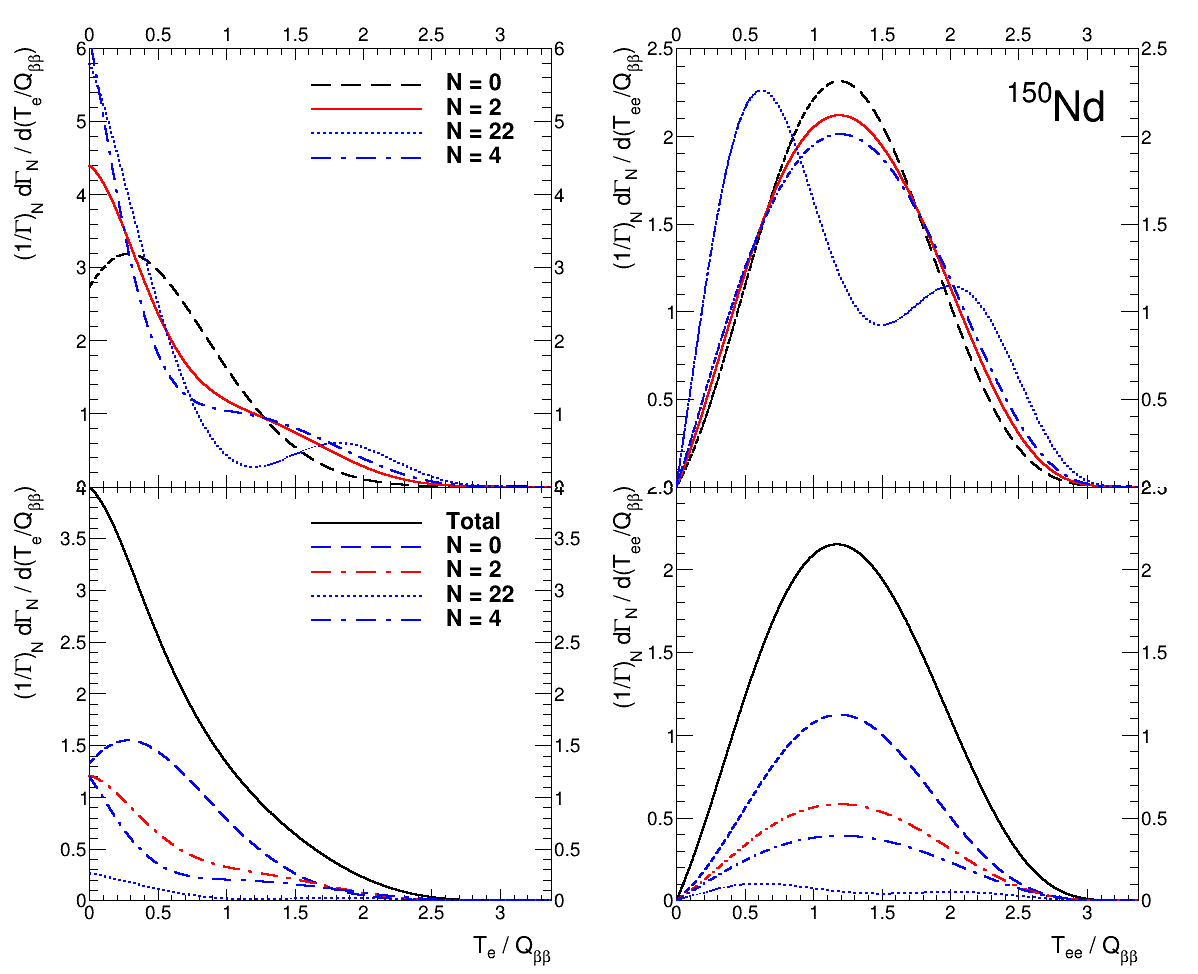
Please see the example figure below.
Is there any way to remove the start/end axis labels from the plots. If you examine the figure closely you will see that the numerical labels are “cut in half” due to the boundary of the TPads. (There are 4 TPads in this figure.)
Hopefully the question is clear. Probably not a lot of explanation is necessary?