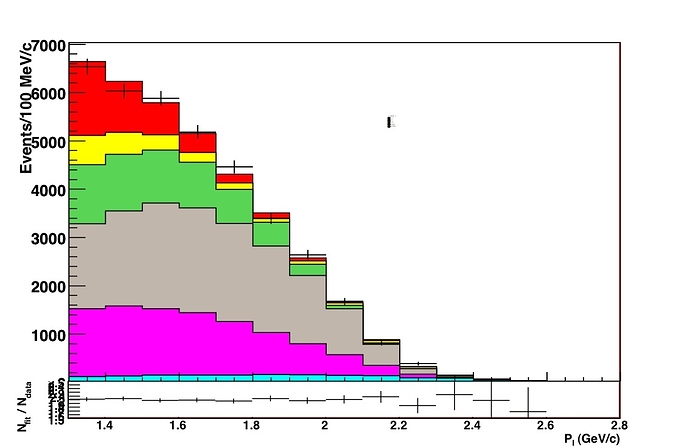
Hello,
I am trying to create a plot in which two histograms are plotted such that the boxes containing the histograms are exactly adjacent, one above the other sharing the border in between. The histograms have the same horizontal axis, so I’d like to remove the horizontal axis from the top plot only, using just the horizontal axis on the bottom plot. I’d like the vertical axes to appear on both plots. I’ve tried drawing the top histogram with the “ah” option to turn off both axes, but I can’t find a way to redraw the y axis after this.
Another problem is that using Draw with a TStack collection of histograms doesn’t seem to respect the “ah” argument, so that axes are always drawn when I try to use a TStack.
I found that using TCanvas::Divide, if I set the spacing arguments to 0, such as MyCanvas.Divide(1, 2, 0. 0.), the color of the resulting TPads is grey, rather than defaulting to the background color, which I have set to white. Thus I have not been able to make the histogram boxes adjacent while still keeping the desired color.
Any help with either of these issues would be greatly appreciated.
Thanks,
Adrian
