Hello ROOTers,
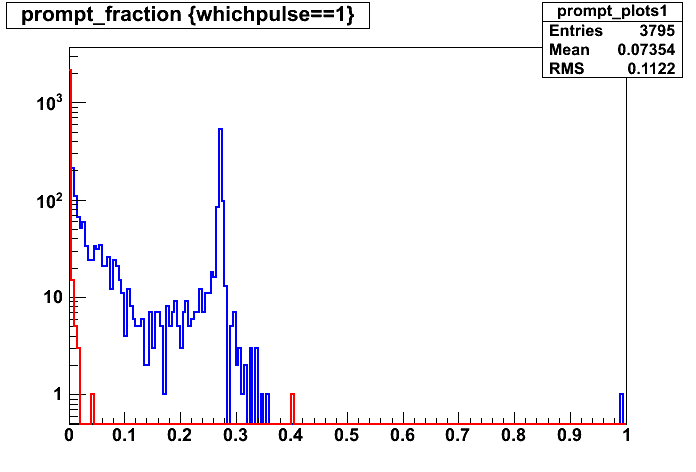
Simple question to help my OCD tendencies be at peace. How might I get the two histograms in the attached image to NOT paint their colored zero bins. I would like the x axis to be a continuous black line.
Thanks.
Hello ROOTers,
Simple question to help my OCD tendencies be at peace. How might I get the two histograms in the attached image to NOT paint their colored zero bins. I would like the x axis to be a continuous black line.
Thanks.
you can use the option bar…
or use gPad->RedrawAxis(); at the of the macro
I have been looking for the same technique, but it is not implemented in the painter.
Couet,
Would you consider to put this option in the painter? I think it is easy to check ymin/ymax and uymin/uymax in the painter. it would be great if we could use the same option in TF1 which “saturates” on log-y pad.
Have you tried RedrawAxis ???
Yes, I tried. It works fine when the line width of the histogram is 1. But if the width is 2 or thicker, it is not hidden by the overlaid axes.
Here is one way to do it:
{
   TFile f("hsimple.root");
   hpx->Draw();
   hpx->SetLineWidth(4);
   hpx->SetLineColor(2);
   gPad->Update();

   // Redraw the frame on top with the same line width
   TFrame *fr = c1->GetFrame()->DrawClone();
   fr->SetLineWidth(4);
   fr->SetFillStyle(0);
   gPad->Modified();
}Thanks couet, this improves the plots a bit but does come with its own problems. The thick frame is a bit ugly, and the frame now overlays the statistics box. Hrm…
I agree. The stats Box can be moved though … Something better should be found.