Hello,
I have a graph about 100 points.
I would like to add oriented arrows on a regular basis (1 every 25 points)
This is basically a contour plot in a “complex plan”…
Do you have any idea how I can achieve that ?
Hello,
I have a graph about 100 points.
I would like to add oriented arrows on a regular basis (1 every 25 points)
This is basically a contour plot in a “complex plan”…
Do you have any idea how I can achieve that ?
NB: Showing a rainbow curve with a colz scale would be an acceptable alternative, but I dont know if rainbow curves are supported with root… ![]()
Surely something can be done. We need to know what are your data (histograms ? graphs ? … ). I you already have a small ROOT script that would be also helpful. May be also an image showing what you want to achieve.
Sure that would be great. At this time, I don’t have idea how to implement it…
I have been implementing a TGraph as following:
{
  TGraph* gr = new TGraph("input.txt");
                 gr->Draw("AC");
}
The input file is here :
input.txt (197.8 KB)
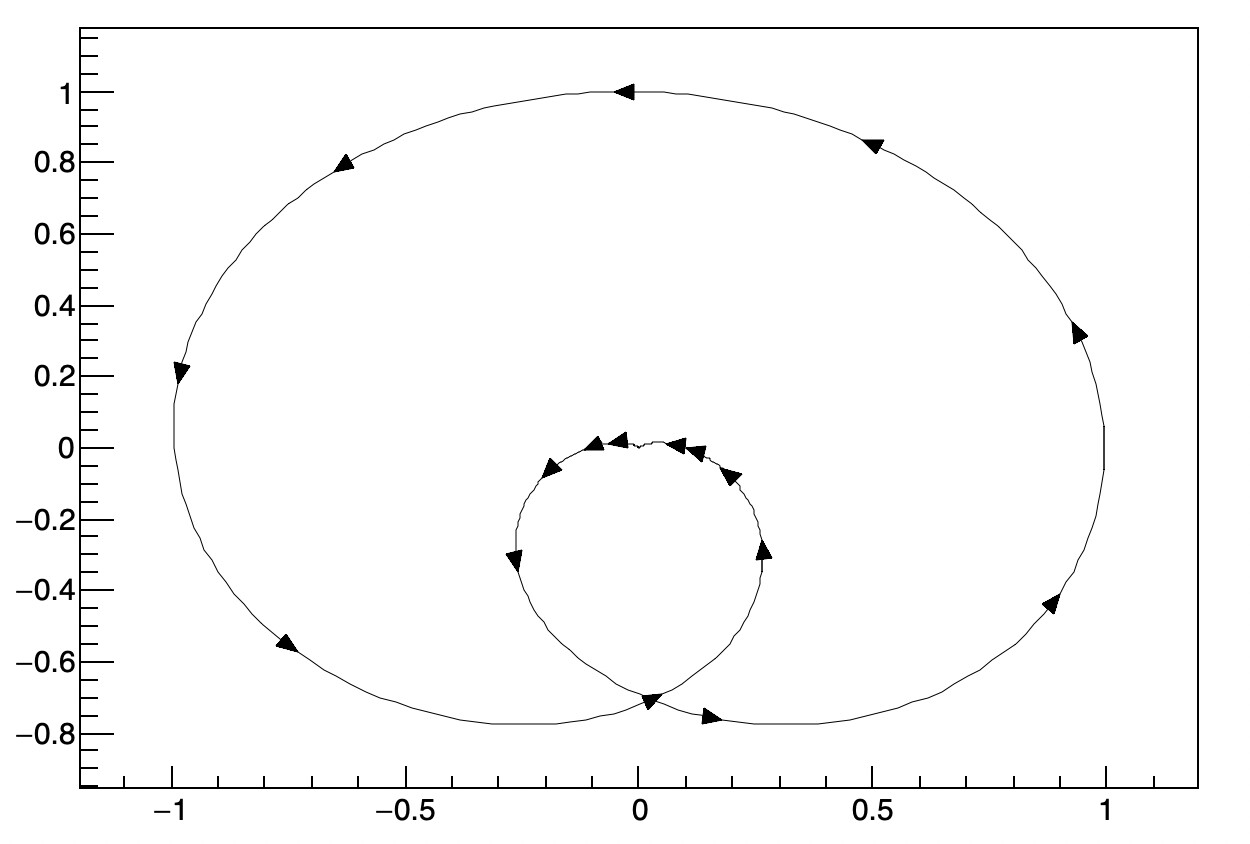
Sorry, I had prepared screenshot but forgot to put it online. Here is what I would like to achieve.
The orientation of the rotating arrows depends on the next/prev data point.
If possible, I would like to avoid marker because they are messed up when changing the X/Y scale.
Is there any chance to rotate markers in TGraph ?
ok I get it now. give me some time to write something.
void grapharrow() {
   auto gr = new TGraph("input.txt");
   TExec *ex = new TExec("ex","DrawArrow();");
   gr->GetListOfFunctions()->Add(ex);
   gr->Draw("AL");
}


void DrawArrow()
{
   Int_t i,n;
   Double_t x1,y1,x2,y2;
   TArrow *a;
   TGraph *g = (TGraph*)gPad->GetListOfPrimitives()->FindObject("Graph");
   n = g->GetN();

   int frequency = 25;
   double dx = 0.001;

   for (i=0; i<n-1; i++) {
      if (i%frequency == 0) {
         g->GetPoint(i,x1,y1);
         g->GetPoint(i+1,x2,y2);
         if (TMath::Abs(x2-x1)>dx) {
            a = new TArrow(x1,y1,x2,y2,0.02,"|>");
            a->SetAngle(45.);
            a->Paint();
         }
      }
   }
}
can you show an example of “rainbow curve” ?
Wow that is great ! I just tested it works like a charm… May I ask you the benefit of using gr->GetListOfFunctions()->Add(ex); instead of passing TGraph as parameter ?
Here is a picture of what I call rainbow curve
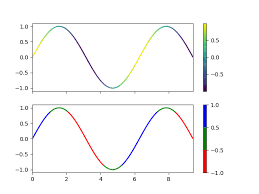
I had in mind to add a column from 0 to N and change the z-scale correspondingly to see where the curve starts and where it ends.
This adds a new painting function to the graph. This function will be executed when the graph is drawn.
One comment to this macro - one should delete created TArrow instances, otherwise they produce memory leak. Or simply do:
TArrow a(x1,y1,x2,y2,0.02,"|>");
a.SetAngle(45.);
a.Paint();
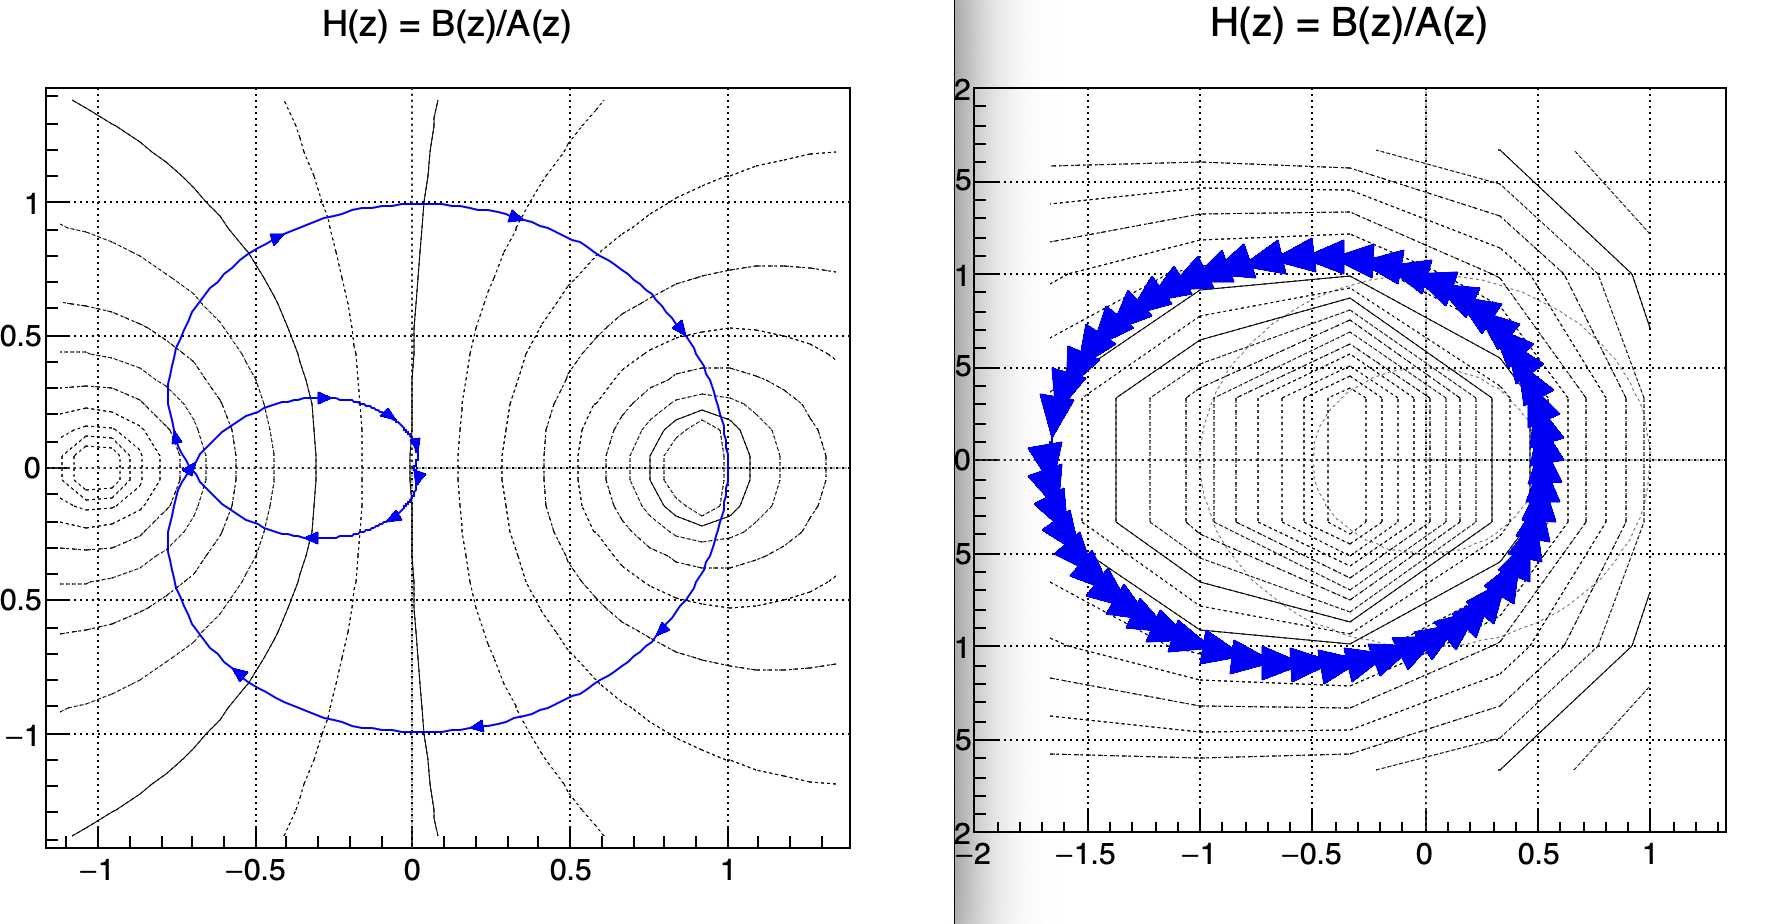
After @linev suggestion the macro is:
void grapharrow() {
   auto gr = new TGraph("input.txt");
   TExec *ex = new TExec("ex","DrawArrow();");
   gr->GetListOfFunctions()->Add(ex);
   gr->Draw("AL");
}


void DrawArrow()
{
   Int_t i,n;
   Double_t x1,y1,x2,y2;
   TGraph *g = (TGraph*)gPad->GetListOfPrimitives()->FindObject("Graph");
   n = g->GetN();

   int frequency = 25;
   double dx = 0.001;

   for (i=0; i<n-1; i++) {
      if (i%frequency == 0) {
         g->GetPoint(i,x1,y1);
         g->GetPoint(i+1,x2,y2);
         if (TMath::Abs(x2-x1)>dx) {
            TArrow a(x1,y1,x2,y2,0.02,"|>");
            a.SetAngle(45.);
            a.Paint();
         }
      }
   }
}
I tried to zoom on the 1st example and I do not see any changes.
Anyway there is nothing we can do.
It seems the arrow size is driven by the width of the canvas, but independant of the height.
I though first it was related to the ratio.
void grapharrow() {
   TCanvas *c = new TCanvas("x","", 1500,500);
   auto gr = new TGraph("input.txt");
   TExec *ex = new TExec("ex","DrawArrow();");
   gr->GetListOfFunctions()->Add(ex);
   gr->Draw("AL");
}
void grapharrow() {
   TCanvas *c = new TCanvas("x","", 1500,1500);
   auto gr = new TGraph("input.txt");
   TExec *ex = new TExec("ex","DrawArrow();");
   gr->GetListOfFunctions()->Add(ex);
   gr->Draw("AL");
}
Both code above are rendering same arrow size, but these ones below are both smaller
void grapharrow() {
   TCanvas *c = new TCanvas("x","", 500,1500);
   auto gr = new TGraph("input.txt");
   TExec *ex = new TExec("ex","DrawArrow();");
   gr->GetListOfFunctions()->Add(ex);
   gr->Draw("AL");
}
nor
void grapharrow() {
   TCanvas *c = new TCanvas("x","", 500,500);
   auto gr = new TGraph("input.txt");
   TExec *ex = new TExec("ex","DrawArrow();");
   gr->GetListOfFunctions()->Add(ex);
   gr->Draw("AL");
}
My reference size is based on 500x500 canvas. I just go:
double scale = gPad->GetWNDC()*gPad->GetWw()/500;
a = new TArrow(x1,y1,x2,y2,0.025/scale,"|>");
This really seems to be related to TArrow.
I just created a TGraph with one data point and the marker gets constant size whatever the width or height.
My guess is that TGraph is drawn based on axis, while TArrow is just a drawing that doesn’t know about axis or canvas size, but for initial positioning. Please let me know if I am wrong.
I see yes, that’s that way. Nothing we can do. You will need to change the arrow size according to the canvas width.