ROOT Version: 6.06/08
Platform: linuxx8664gcc
Compiler: gcc (Ubuntu 5.5.0-12ubuntu1~16.04) 5.5.0 20171010
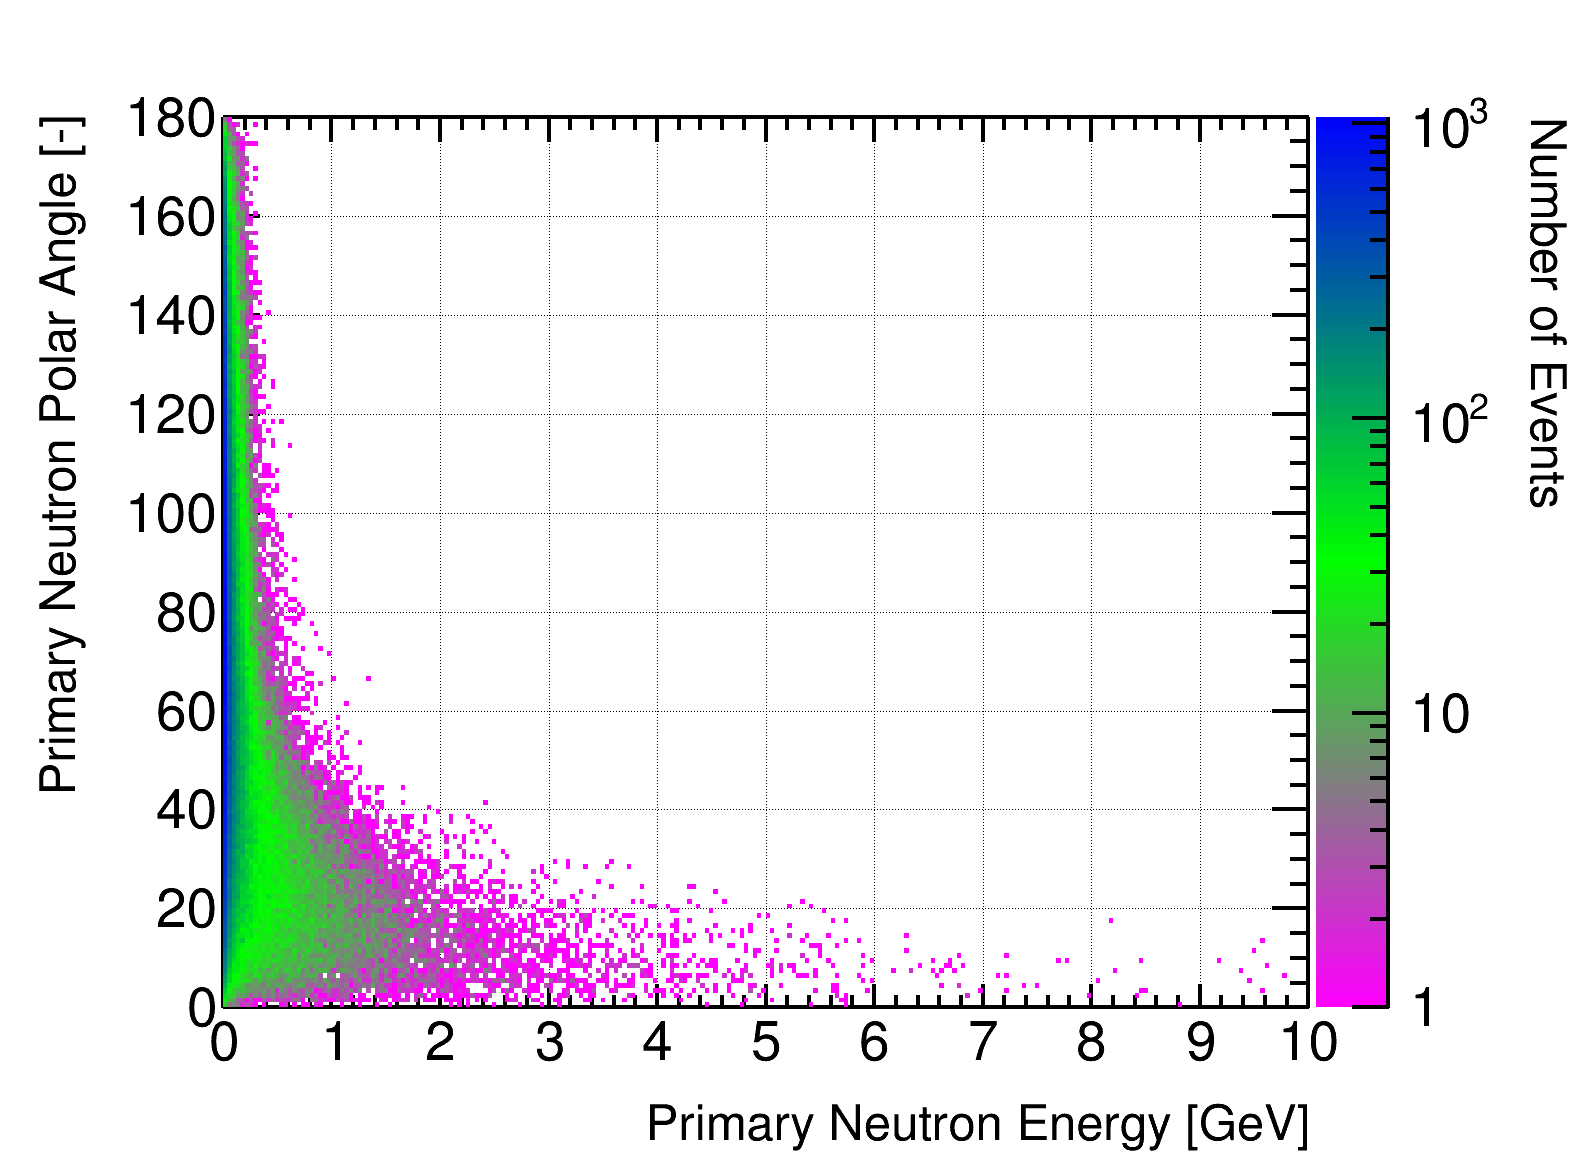
I was trying to re-style some already existing plots. Everything works fine but the TPaletteAxis seems not to be affected. I expect a plot like this:
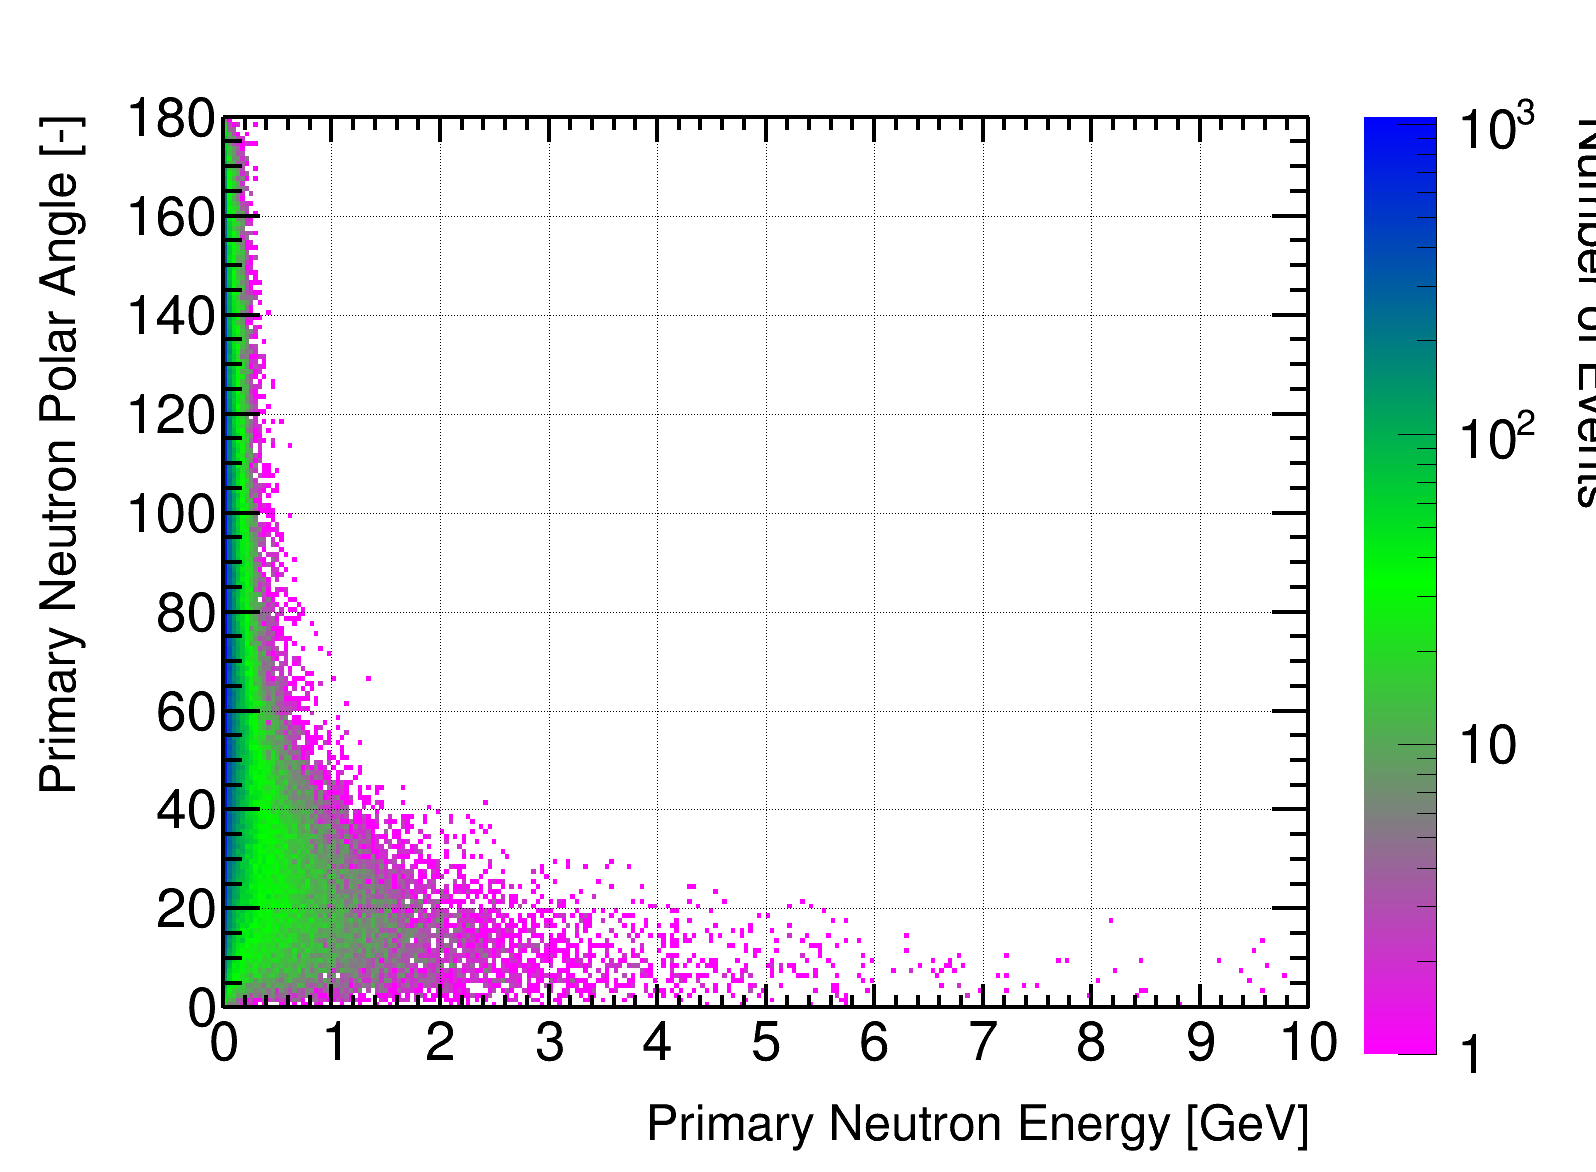
But it looks like this:
import ROOT
from array import array

ROOT.gROOT.SetBatch(1)

if __name__ == "__main__":

    f_names = [
            "argon_track_length",
            "lost_neutron_energy",
            "min_dist_vtx_argon_recoil",
            "min_dist_vtx_proton_recoil",
            "min_dist_vtx_proton_recoil_z",
            "neutron_vs_beam_angle",
            "neutron_vs_proton_angle",
            "primary_neutron_kinematics",
            "primary_recoil_proton_kinematics",
            "proton_dist_vs_time",
            "proton_track_length",
            "proton_track_length_vs_energy",
            "proton_vs_beam_angle",
            "proton_vs_neutron_track_angle"
            ]

    for name in f_names:

        f = ROOT.TFile( name + ".root" )

        c = f.Get("")

        p = c.GetPrimitive("")

        del f
        del c

        c0 = ROOT.TCanvas("","",1600,1200)
        c0.SetGrid(1)
        c0.SetLeftMargin(0.14)
        c0.SetRightMargin(0.18)
        c0.SetBottomMargin(0.14)

        NRGBs = 3
        NCont = 200
        red   = [1.00, 0.00, 0.00]
        green = [0.00, 1.00, 0.00]
        blue  = [1.00, 0.00, 1.00]
        stops = [0.00, 0.50, 1.00]
        redArray    = array('d',red)
        greenArray  = array('d',green)
        blueArray   = array('d',blue)
        stopsArray  = array('d',stops)

        ROOT.TColor.CreateGradientColorTable(NRGBs, stopsArray, redArray, greenArray, blueArray, NCont)
        ROOT.gStyle.SetOptStat(0)
        ROOT.gStyle.SetOptTitle(0)
        ROOT.gStyle.SetStatX(0.80)
        ROOT.gStyle.SetStatY(0.85)
        ROOT.gStyle.SetStatW(0.2)
        ROOT.gStyle.SetStatH(0.2)
        ROOT.gStyle.SetLineWidth(4)
        ROOT.gStyle.SetNumberContours(200)
        ROOT.gPad.SetTickx()
        ROOT.gPad.SetTicky()
        ROOT.gPad.SetLogx(0)
        ROOT.gPad.SetLogy(0)
        ROOT.gPad.SetLogz(0)

        p.GetXaxis().SetTitleOffset(1.4)
        p.GetXaxis().SetTitleSize(0.045)
        p.GetXaxis().SetLabelSize(0.05)
        p.GetYaxis().SetTitleOffset(1.4)
        p.GetYaxis().SetTitleSize(0.045)
        p.GetYaxis().SetLabelSize(0.05)
        p.GetZaxis().SetTitleOffset(1.4)
        p.GetZaxis().SetTitleSize(0.045)
        p.GetZaxis().SetLabelSize(0.05)
        p.GetZaxis().RotateTitle(1)

        if "min_dist_vtx" in name or "vs_beam" in name:
            ROOT.gPad.SetLogx(1)
            p.GetZaxis().SetTitle("Number of Events")

        elif "track_length" in name:
            ROOT.gPad.SetLogx(1)
            ROOT.gPad.SetLogy(1)
            p.GetZaxis().SetTitle("Number of Tracks")

        elif "lost" in name or "neutron_kinematics" in name:
            ROOT.gPad.SetLogz(1)
            p.GetZaxis().SetTitle("Number of Events")

        elif "proton_kinematics" in name or "vs_time" in name:
            ROOT.gPad.SetLogz(1)
            p.GetZaxis().SetTitle("Number of Protons")

        else:
            ROOT.gPad.SetLogx(0)
            p.GetZaxis().SetTitle("Number of Events")

        p.Draw("colz")

        c0.Print("../png/" + name + "_.png")

        del p
        del c0