Red line around histogram and width of axis

Hello,

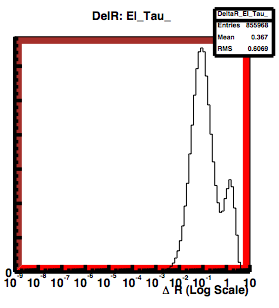
I would like to get rid of the red line around my histogram. Please see the attached histogram; for some reason, if I set the fill color of canvas to be 0 using TStyle, the red line comes up as a side effect and I cannot figure out how to get rid of it.

I would also like to make the line width of the axis to be the same as that of the histogram line width and again I failed to find out how.

Actually I would also like to set the line width of the stats box. I can chose either this thicknes or no line. Is there a way around?

Could you please teach me how to do these things?

Thank you for your help in advance.

FYI, I am using Root 5 on MacOSX with PyROOT. though I cannot think of my environment affecting this problem…

Cheers
Akira

The red line around the pad is not visible anymore when you save a pad in a bitmap file. By default the stat box’s line width is one pixel. You should have change it in order to get this output. Do you have a small macro reproducing your problem ?

Hello

Thank you for your reply.
Unfortunately your point is not valid since the attached picture was
cut from a screen shot of pdf file saved from the canvas I made and
it even shows up when I print the pdf file.

I’m trying to plot 36 histogram at once and this effect is particularly
bad since it seems there seems to be a minimum width for this red
line and the stat box line and no matter how small the histogram is,
they maintain certain thickness. I tried ps and png format and the result
is the same.

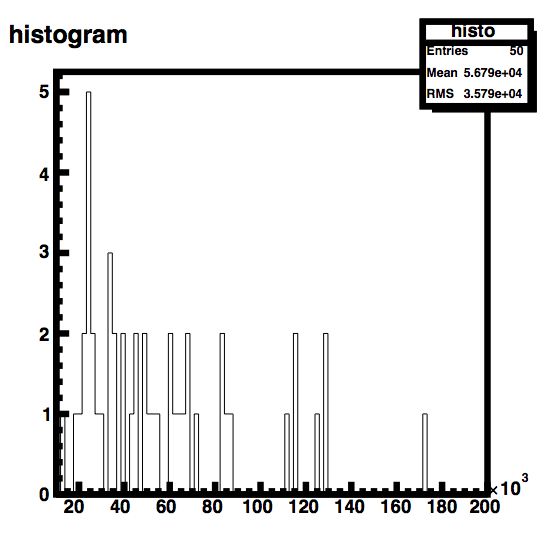
Following is a simple script to reproduce the problem.
If I comment out mystyle.SetCanvasColor(0),
the red line will not appear though the thickness of the stat box is
still very thick compared to the histogram line width. True I am
setting mystyle.SetHistLineWidth(0) but if I do
mystyle.SetStatBorderSize(0) then the stat box line will dissappear
instead of becoming the same width as the histo line width.

Could you please take a look?

Thanks
Akira

from ROOT import *

fileName="user.AkiraShibata.000001.T1.try3.AANT1.merged.root"

## style
mystyle=TStyle("mystyle", "my custom style")
mystyle.SetCanvasColor(0)
mystyle.SetTitleFillColor(0)
mystyle.SetTitleBorderSize(0)
mystyle.SetStatColor(0)
mystyle.SetHistLineWidth(0)
gROOT.SetStyle("mystyle")

# read in ntuple
CollectionTree=TChain("CollectionTree")
EV0=TChain("EV0")
EVCands=TChain("EVCands")
# list of all chains
chains=[CollectionTree,EV0,EVCands]
for i in chains: 
  i.Add(fileName)
chain=EVCands

canvas=TCanvas()
canvas.SetCanvasSize(1200, 1200)
canvas.Divide(6,6)

histo=TH1F("histo","histogram",100,10000,200000)
chain.Draw("TJet_p_T>>histo","","goff")

for i in xrange(36):
  canvas.cd(i+1)
  histo.Draw("")

canvas.Print("test.pdf")

I’ll attach the pdf file as well just in case
test.pdf (72.7 KB)

I cannot run the example you sent. It is just a copy/paste of a part of a larger program. I do not have the files it uses. Please send me something I can run which reproduces the problem.

Thanks,

It is not a part of a larger program. I wrote this especially for you!
Do you want me to send you to attach the ntuple as well? You can
just change the lines where I’m reading in the file to the chain and
change the name of the tree and variable name to plot.

OK, I’ll make a small Ntuple so I can upload here.

Hello

So here we go.

  1. Save both of these files into the same directory.
  2. from that directory python -c “from test import *”
  3. view the file test.pdf

Thanks for your help again.

Cheers
Akira
ttbar.InsertEverything.root (197 KB)

Sorry, I couldn’t put two attachment in one place. Here’s the script
test.py (728 Bytes)

With the following example I do not see the red lines.

{
   TCanvas *c = new TCanvas("c","c",0,0,900,900);
   c->Divide(6,6);
   for (int i=1; i<36>cd(i);
      hpx->Draw();
   }
   c->Print("c.pdf");
}

c.pdf (74.8 KB)

Hi

I’m trying to follow you as closely as possible but I still get red lines.

{
  //style 
  TStyle mystyle("mystyle", "my custom style");
  mystyle.SetCanvasColor(0);
  mystyle.SetTitleFillColor(0);
  mystyle.SetTitleBorderSize(0);
  mystyle.SetStatColor(0);
  mystyle.SetHistLineWidth(0);
  gROOT->SetStyle("mystyle");

  //read in ntuple
  TChain *CollectionTree = new TChain("CollectionTree");
  TChain *EV0 = new TChain("EV0");
  TChain *EVCands = new TChain("EVCands");
  //list of all chains
  CollectionTree->Add("ttbar.InsertEverything.root");
  EV0->Add("ttbar.InsertEverything.root");
  EVCands->Add("ttbar.InsertEverything.root");
  
  TChain* chain=EVCands;

  TCanvas *canvas = new TCanvas("c","c",0,0,1200,1200);
  canvas.Divide(6,6);

  TH1F *histo = new TH1F("histo","histogram",100,10000,200000);
  chain->Draw("TJet_p_T>>histo","","goff");

  for(int i=1; i<36>cd(i);
    histo->Draw("");
  }
  canvas->Print("test.pdf");

}

this forum seems to have a bug showing C++ code.

the following shouldn’t read as it is.

  for(int i=1; i<36>cd(i);
    histo->Draw("");
  }

I’ll attach file again just in case
test.C (887 Bytes)

OK I finally found how to turn off the red line.
SetFrameBorderMode=0
either 1 or -1 will cause red line around it.
What is BorderMode anyway?

Now how do I get the axis thinner?

Cheers
Akira

For some reason I do not understand yet, it seems this red line appears because you are using your own style. If you do:

  gStyle->SetCanvasColor(0);
  gStyle->SetTitleFillColor(0);
  gStyle->SetTitleBorderSize(0);
  gStyle->SetStatColor(0);
  gStyle->SetHistLineWidth(0);

instead of :

 TStyle mystyle("mystyle", "my custom style");
  mystyle.SetCanvasColor(0);
  mystyle.SetTitleFillColor(0);
  mystyle.SetTitleBorderSize(0);
  mystyle.SetStatColor(0);
  mystyle.SetHistLineWidth(0);
  gROOT->SetStyle("mystyle");

Then, there is no red line.

Sorry aggain, my question now is how to get this thick axis thinner?


OK, so using my own style is making histogram behave funny.
It seems that TStyle default for FrameBorderMode is 1, so if I
apply my style, this default will be propagated to the gStyle?

only guessing though.

AKira

with the latest ROOT version you can do:

gStyle->SetLineScalePS(0.3);

Hi,

I tried this but didn’t seem to make any difference.
What is it supporsed to do and what is the argument I’m passing?

My root version is
Version 5.11/02 19 April 2006

Should I update it to newer one?

Thanks
Akira

Sorry I spoke a bit too soon.
This worked if I saved the histo in ps format but not in pdf.

So there’s no method for changing the axis width?

Cheers
Akira

As I said, it works with PDF using the latest ROOT version which will be released this week. Previously it was implemented for PS output only.

Hi everybody,
I use ROOT with cygwin on WIN XP.
i have the same problem with the red line when i use

gPad->SetFillColor(0)

the red line appeares, but only on the right border.
It disappears when i save the image as .eps .ps or .gif, but still remain when i save it as .pdf.

Is it a bug or there’s some way to make the line disappear?

Thank to everybody who will answer me!

Bye

Pietro