void S()
{
   TProfile *hprof1 = new TProfile("hprof1", "Eccentricity vs b for n = 2 for S = 0", 40, 0, 20);
   TProfile *hprof2 = new TProfile("hprof2", "Eccentricity vs b for n =2 for S = 1", 40, 0, 20);
   TProfile *sum = new TProfile("sum", "sum", 40, 0, 20);
   sum->Add(hprof1,hprof2);
}
Thank you very much! The above solution works. But is it possible to make the marker color different for the entries of hprof1 and hprof2?
hprof1->SetMarkerColor()
You have this kind of code:
   hprof5->Add(A,B);
   A->SetMarkerColor(kGreen);
   B->SetMarkerColor(kRed);
   hprof5->Draw();
So ou change the color of A and B and you draw hprof5 which is a new histogram. hprof5 is the sum of A and B . A and B do not exist anymore in hprof5. So what you get is normal. change the color of hprof5 and change the marker style also because the default marker is a dot.
If you want to keep the existence of A and B on the plot you should use THStack, not Add.
I used THStack. But the marker color does not change.
S.C (1.2 KB)
Also I am having error finding the ratio between the two THStack hs1 and hs2.
Ratio.C (625 Bytes)
Try with:
TProfile *hp1 = ((TProfile*)(hs1->GetStack()->Last())); // the sum
TProfile *hp2 = ((TProfile*)(hs2->GetStack()->Last())); // the sum
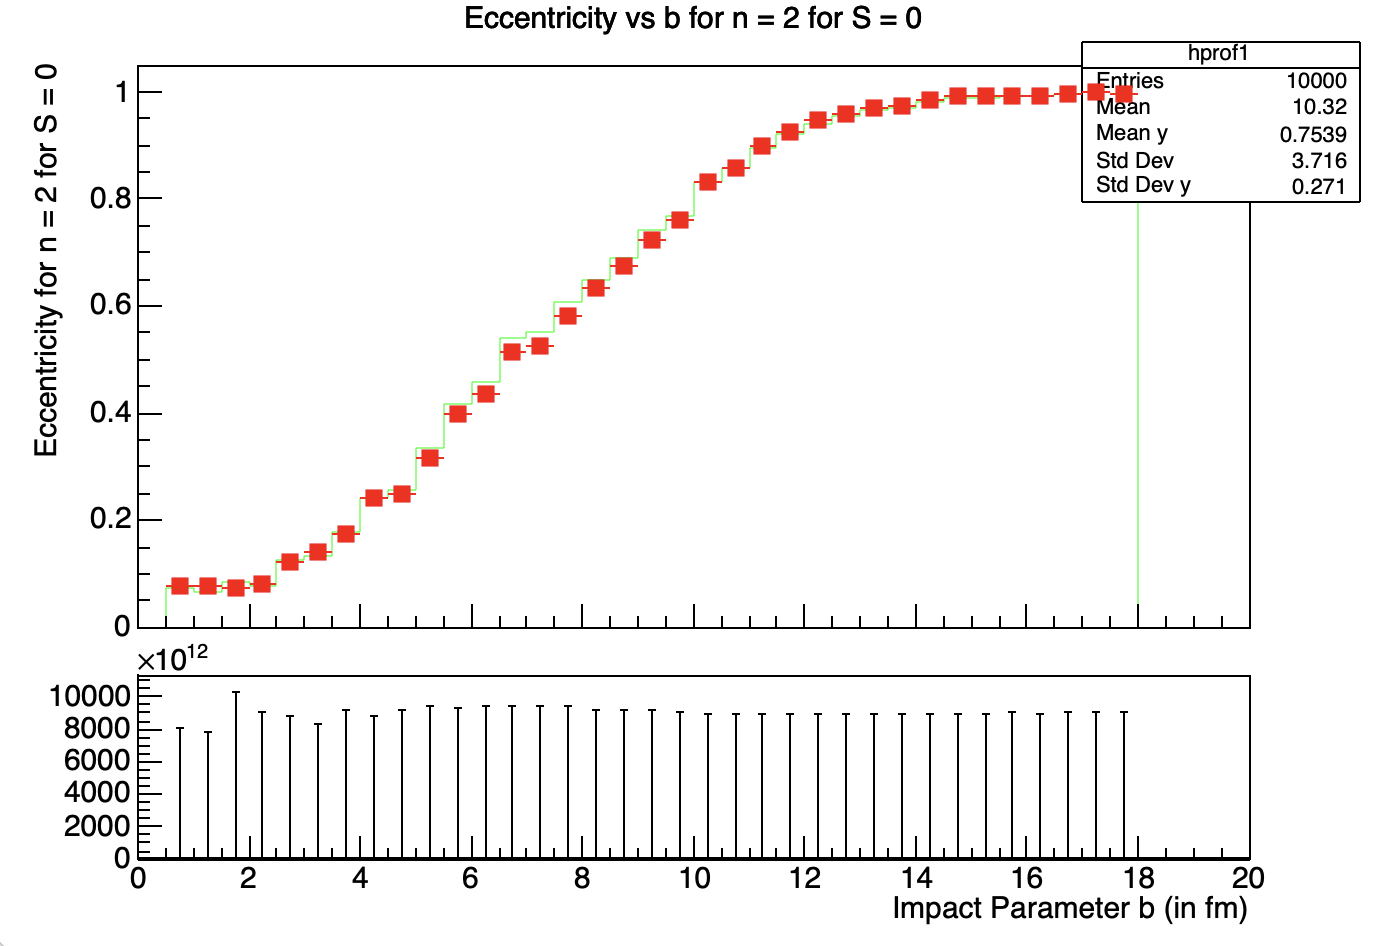
I am getting some error again. Can you check this macro?
Ratio.C (749 Bytes)

The warning you get is related to bins with content = 0 (i.e., you have 5 such bins).
That’s not a problem for the ratio plot.
BTW. You get ratio errors (in the lower pad) of the order of 10^16, which seems ridiculous. Maybe @moneta can comment on it.
So let me describe you what I have done so far. I had 4 histograms A, B, C, and D in the root files.
2_S0.root
2_S1.root
3_S0.root
3_S1.root
Then I formed two stack histograms. A+B = hs1 and C+D = hs2. After that I wrote hs1 and hs2 in 2 different root files. (i.e. n2s01 and n3s01 using S.C).
Then I tried to find the ratio between hs1 and hs2 using
Ratio.C (749 Bytes)
S.C (1.2 KB)
2_S0.root (4.9 KB)
2_S1.root (4.9 KB)
3_S0.root (4.9 KB)
3_S1.root (4.9 KB)
Help or suggestions please.
Thanks!
/* Eccentricity vs Impact Parameter b for n = 2 for both Shadowing = 0 and Shadowing = 1 */
void S()
{
TFile* fa = new TFile("2_S0.root", "READ");
TProfile* A = (TProfile*) fa->Get("hprof1"); // for n = 2 for Shadowing = 0
TFile* fb = new TFile("2_S1.root", "READ");
TProfile* B = (TProfile*) fb->Get("hprof2"); // for n = 2 for Shadowing = 1
TFile* fc = new TFile("3_S0.root", "READ");
TProfile* C = (TProfile*) fc->Get("hprof3"); // for n = 3 for Shadowing = 0
TFile* fd = new TFile("3_S1.root", "READ");
TProfile* D = (TProfile*) fd->Get("hprof4"); // for n = 3 for Shadowing = 1
TCanvas *c1 = new TCanvas();
A->SetMarkerColor(kGreen);
B->SetMarkerColor(kRed);
A->SetLineColor(kGreen);
B->SetLineColor(kRed);
A->SetMarkerStyle(20);
B->SetMarkerStyle(21);
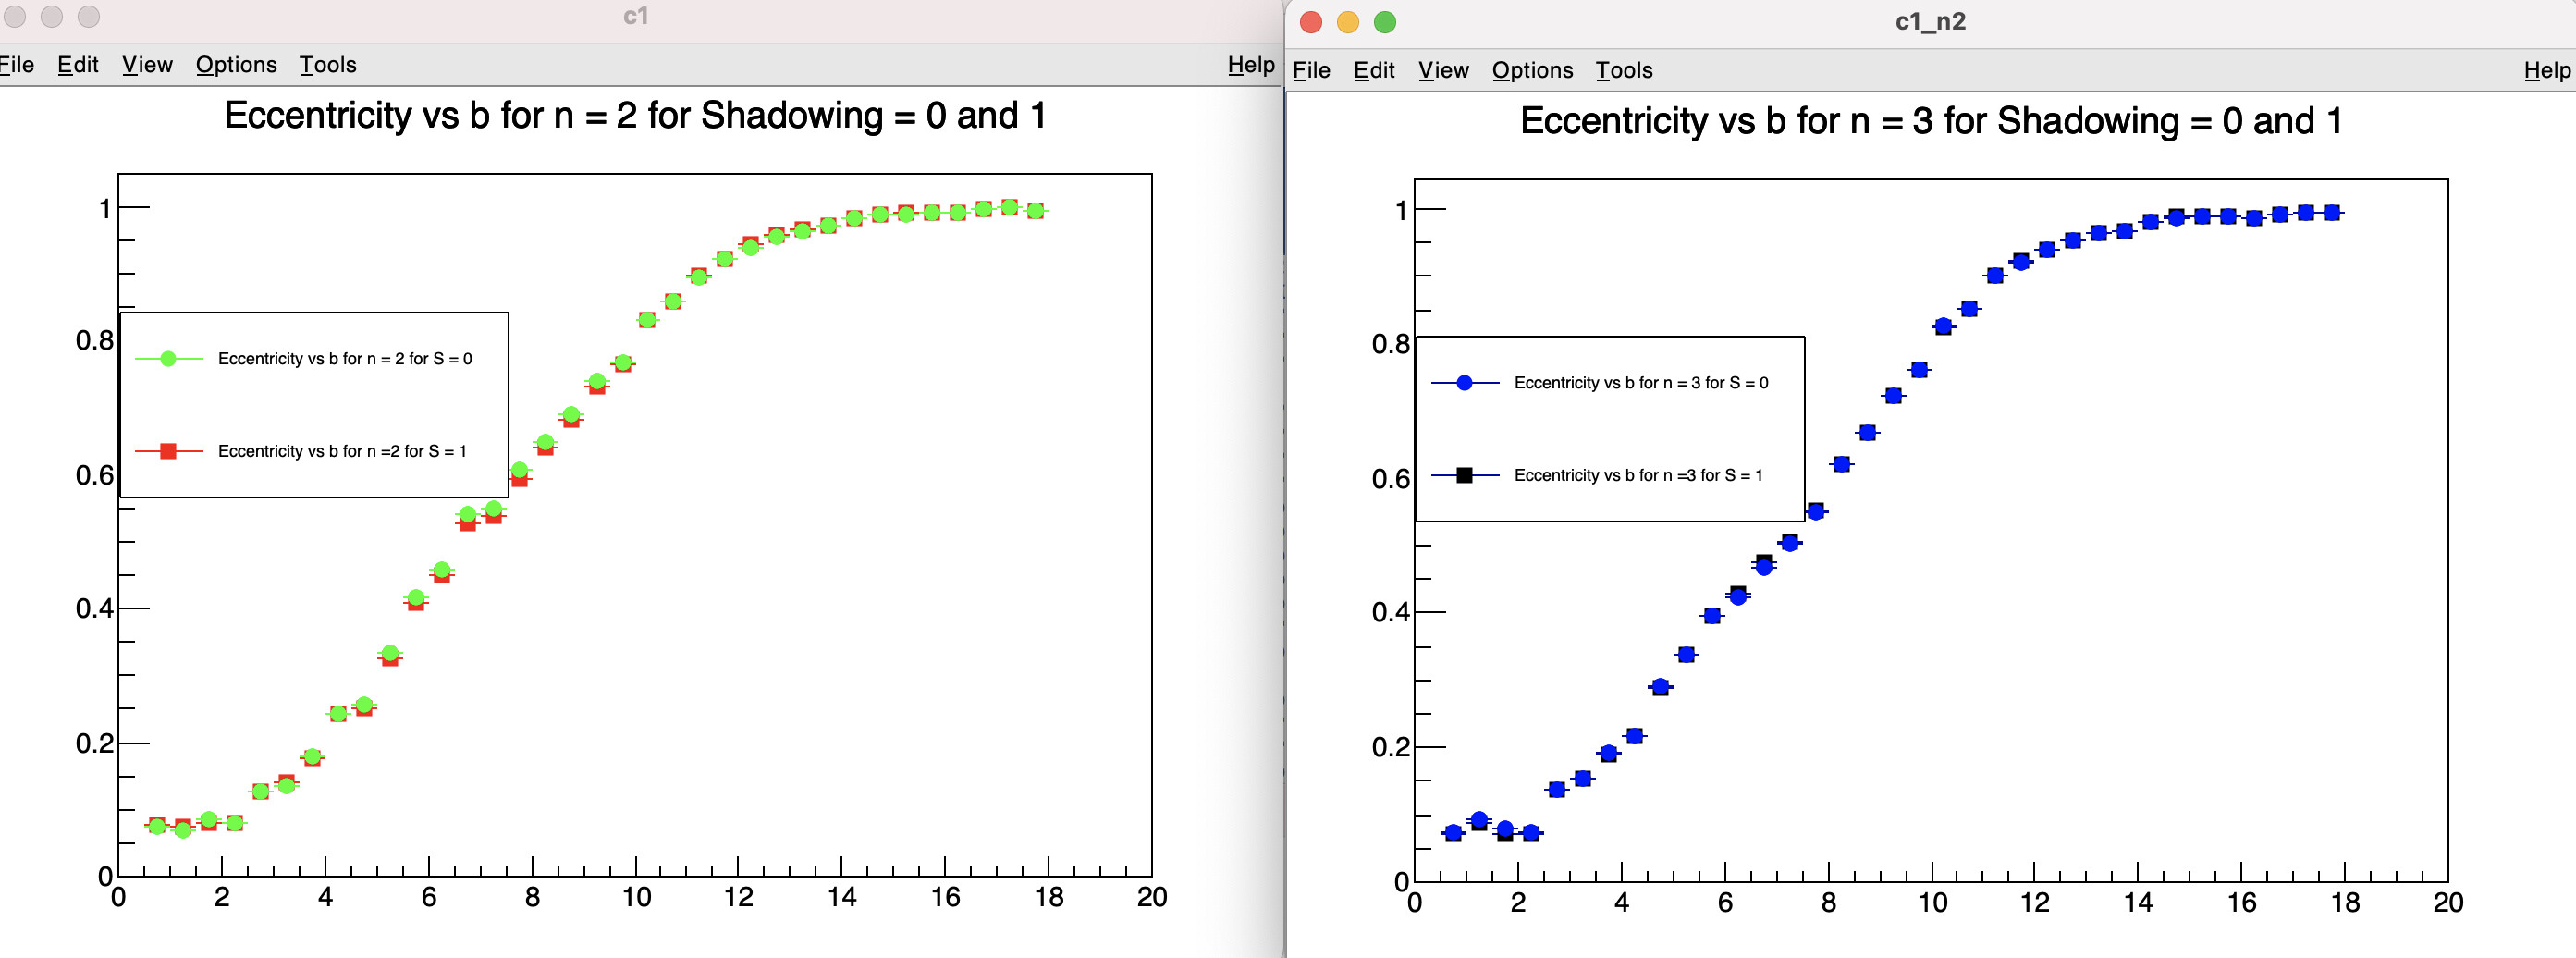
THStack *hs1 = new THStack("hs","Eccentricity vs b for n = 2 for Shadowing = 0 and 1");
hs1->Add(A);
hs1->Add(B);
hs1->Draw();
TCanvas *c2 = new TCanvas();
C->SetMarkerColor(kBlue);
D->SetMarkerColor(kBlack);
C->SetMarkerStyle(20);
D->SetMarkerStyle(21);
C->SetLineStyle(20);
D->SetLineStyle(21);
THStack *hs2 = new THStack("hs2","Eccentricity vs b for n = 3 for Shadowing = 0 and 1");
hs2->Add(C);
hs2->Add(D);
hs2->Draw();
c1->BuildLegend();
c2->BuildLegend();
}
Can you help me just find the ratio between A and B histograms?
/* Eccentricity vs Impact Parameter b for n = 2 for both Shadowing = 0 and Shadowing = 1 */
void S()
{
TFile* fa = new TFile("2_S0.root", "READ");
TProfile* A = (TProfile*) fa->Get("hprof1"); // for n = 2 for Shadowing = 0
TFile* fb = new TFile("2_S1.root", "READ");
TProfile* B = (TProfile*) fb->Get("hprof2"); // for n = 2 for Shadowing = 1
TFile* fc = new TFile("3_S0.root", "READ");
TProfile* C = (TProfile*) fc->Get("hprof3"); // for n = 3 for Shadowing = 0
TFile* fd = new TFile("3_S1.root", "READ");
TProfile* D = (TProfile*) fd->Get("hprof4"); // for n = 3 for Shadowing = 1
TCanvas *c1 = new TCanvas();
A->SetMarkerColor(kGreen);
B->SetMarkerColor(kRed);
A->SetLineColor(kGreen);
B->SetLineColor(kRed);
A->SetMarkerStyle(20);
B->SetMarkerStyle(21);
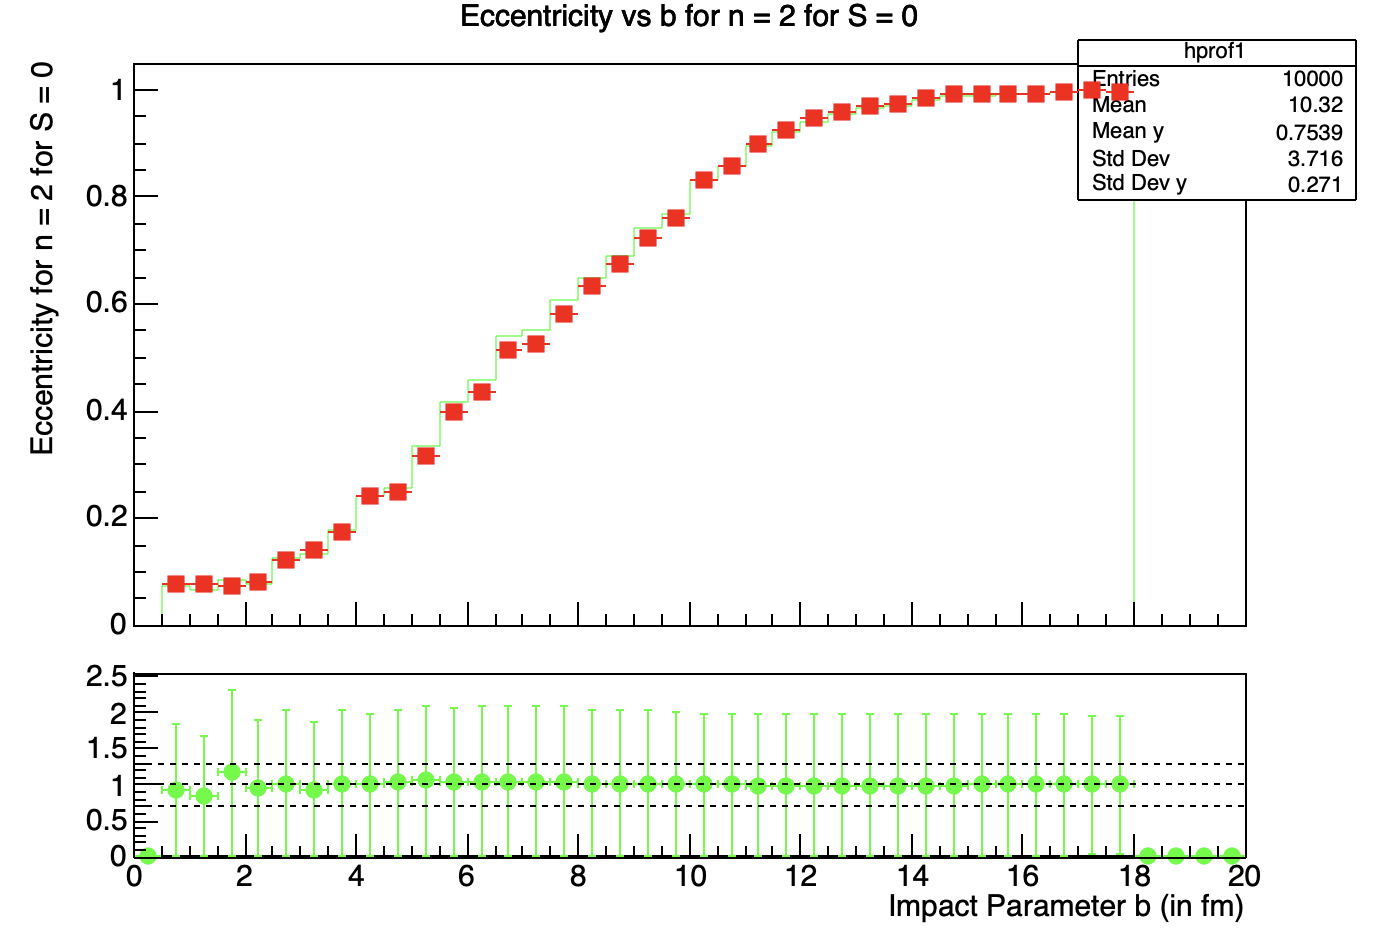
auto rp = new TRatioPlot(A,B);
rp->Draw();
}
I dont understand the plot below? why the large “error bar” values? Can someone help me understand this?
Yes, these errors are weird. May be @moneta can comment.
@moneta Sir, please help.
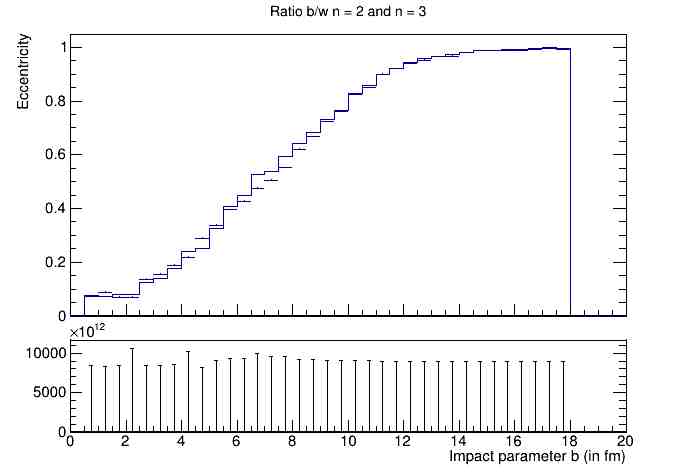
When we do:
   A->Divide(B);
   A->Draw();
The plot looks ok
/* Eccentricity vs Impact Parameter b for n = 2 for both Shadowing = 0 and Shadowing = 1 */

void S()
{
   TFile* fa = new TFile("2_S0.root", "READ");
   TProfile* A = (TProfile*) fa->Get("hprof1");   // for n = 2 for Shadowing = 0

   TFile* fb = new TFile("2_S1.root", "READ");
   TProfile* B = (TProfile*) fb->Get("hprof2");   // for n = 2 for Shadowing = 1

   TFile* fc = new TFile("3_S0.root", "READ");
   TProfile* C = (TProfile*) fc->Get("hprof3");   // for n = 3 for Shadowing = 0

   TFile* fd = new TFile("3_S1.root", "READ");
   TProfile* D = (TProfile*) fd->Get("hprof4");   // for n = 3 for Shadowing = 1

   TCanvas *c1 = new TCanvas();
   A->SetMarkerColor(kGreen);
   B->SetMarkerColor(kRed);
   A->SetLineColor(kGreen);
   B->SetLineColor(kRed);
   A->SetMarkerStyle(20);
   B->SetMarkerStyle(21);

   auto rp = new TRatioPlot(A,B,"divsym");
   rp->Draw();
}