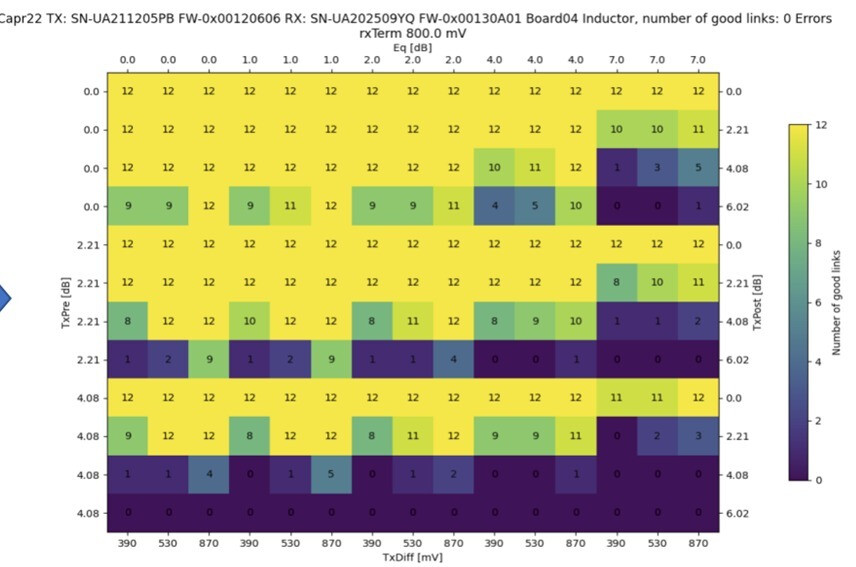
Dear ROOTers, I was asked to reproduce a histogram looking like the attached figure. I am usually quite ok with ROOT, but I really don’t know how to proceed to plot this with the TH2 class. Any idea or example would be appreciated.
The z-axis part is trivial, but what blocks me is the lateral axis, as you can see values are repeated, I am not sure I can customize the TAxis this way.
So far I am thinking of creating a unique (X,Y) intermediate bin for each entry, so they show up as sorted in the histogram , then delete the axis, and slam text on top of each bin. That seems feasible, but I am sure there is a more efficient way.
Any help is appreciated !
Cheers ,
M