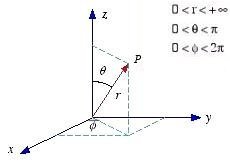
I want to draw a histogram in spherical coordinates. As far as I understand x is mapped to the latitude (theta), y to the longitude (phi) angle and z is the radius. Normally they have the following ranges (in degrees):
0 (LessOrEqualThan) theta (LessOrEqualThan) 180 and
0 (LessOrEqualThan) phi (LessOrEqualThan) 360
(Sorry for the bad format but the less sign mixes up the post)
Did I mix the convention?
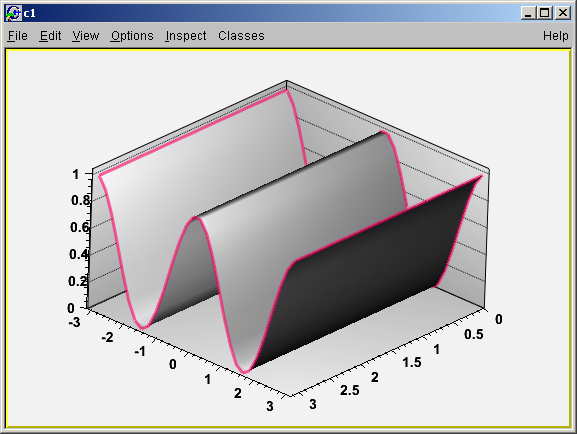
Imagine the following code that draws a cos**2 distribution:
void test2d()
{
	TH2D * twod = new TH2D("hpxpy","py vs px",36,0,3.14,72,-3.14,3.14);
	twod->SetOption("sph lego2 z");
	TF2 * f= new TF2("f","cos(x)*cos(x)",0,3.14,-3.14,3.14);
	twod->FillRandom("f",20000);
	twod->Draw();
}
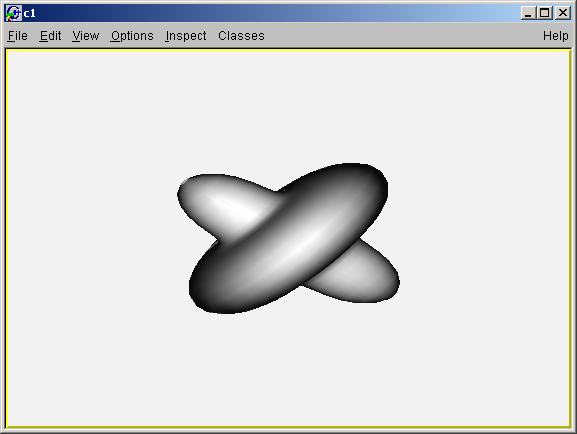
I would expect to see something that looks like a “p-orbital”. How do I set up the ranges correctly to see this distribution?
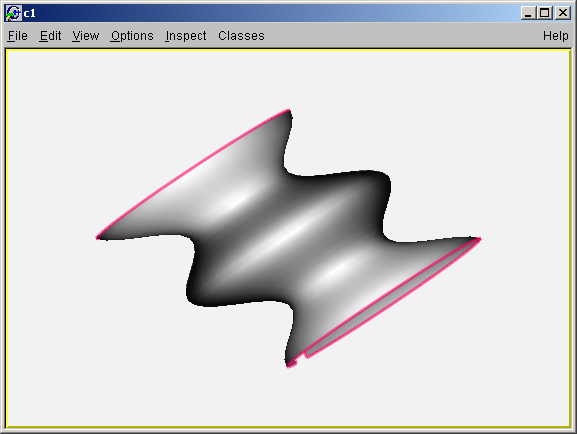
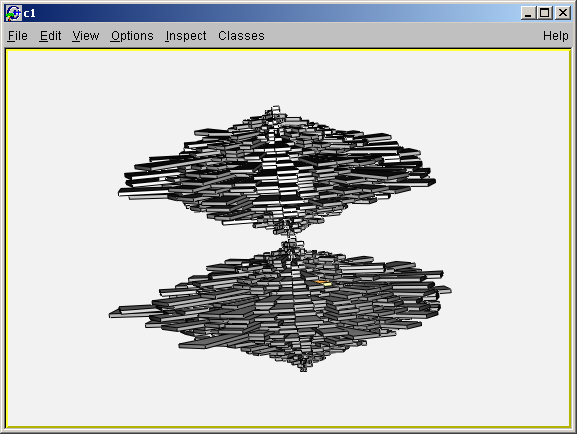
no unfortunatly it does not look like I expected. I attached two pictures to clearify what I expect.
The second picture shows how I expect what the theta and the phi angles are. The first picture shows how I expect in this frame how the cos(x)*cos(x) distribution should look like.
In ROOT, option “sph” or “cyl” means the following:
you have a “coordinate sphere” or “coordinate cylinder” with radius ==
gStyle->GetLegoInnerR() and you simply map your surface (lego plot) from cartesian to sphere/cylinder. For example:[/img]