Hi !
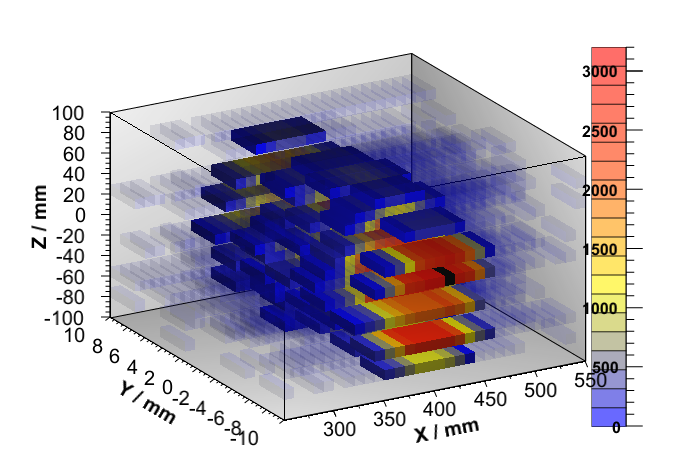
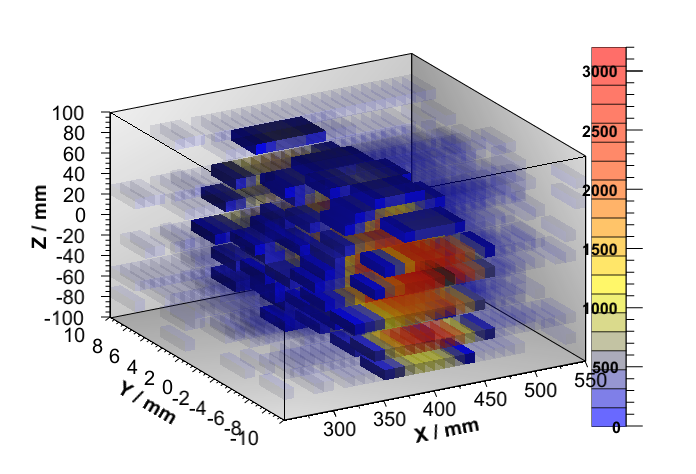
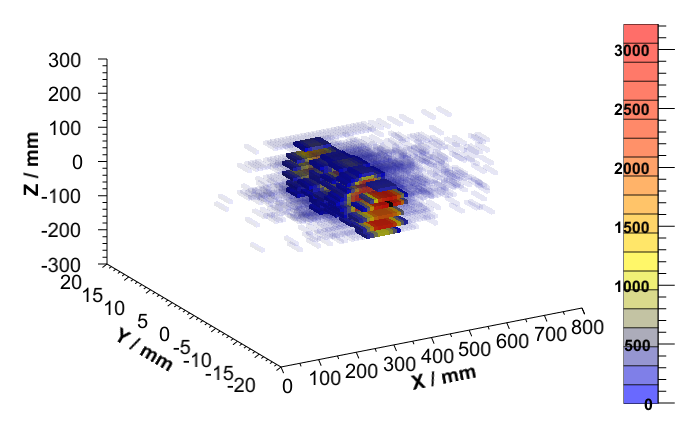
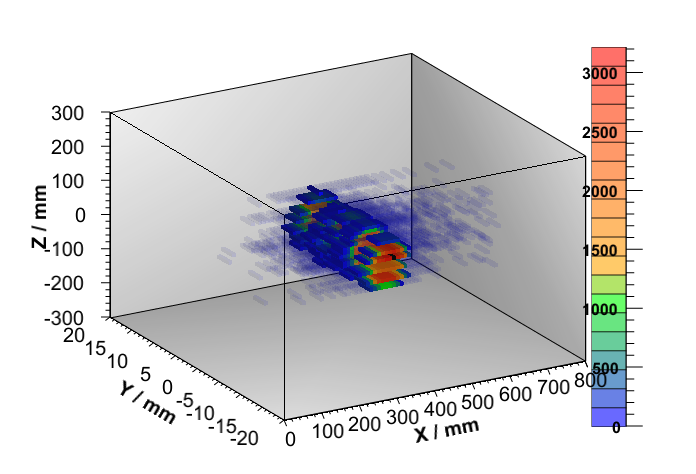
I have some 3D histograms drew with the option “glcolz”. One of them is attached here.
The code I use is an example from ROOT tutorials. The path is $ROOTSYS/tutorials/gl/vox2.C.
I have some questions about it.
- The color of red is not bright. It looks like the red of watermelon, a little bit pink in it. But the RGB of the red I use is 1,0,0. And it is not transparent.
I was wandering if I could make the red brighter? - Around the histogram, there are three faces, which are at back, right and bottom. Can they be removed or turned to transparent?
- How to move the palette? I have tried the code like this
[code] gPad->Update();
TPaletteAxis palette = (TPaletteAxis)hist2->GetListOfFunctions()->FindObject(“palette”);
  // the following lines move the palette. Choose the values you need for the position.
  palette->SetX1NDC(0.9);
  palette->SetX2NDC(0.92);
  palette->SetY1NDC(0.2);
  palette->SetY2NDC(0.8);
  gPad->Modified();
  gPad->Update();[/code]
But it didn’t work.