{
  TCanvas *c2 = new TCanvas("c2", "My Canavas", 1200, 450);
  c2->Divide(2,1);
  c2->cd(1);

  hQtot_Bi->SetNormFactor(1);
  hQtot_Bi->SetLineColor(kBlue);
  hQtot_Bi->SetLineWidth(2);
  hQtot_Bi->Draw("HIST");
  hQtot_Bi->SetStats(0);
  hQtot_Bi_d->Add(hQtot_Bi_g,-1);
  hQtot_Bi_d->SetNormFactor(1);
  hQtot_Bi_d->SetMarkerStyle(20);
  hQtot_Bi_d->SetMarkerSize(1);
  hQtot_Bi_d->Draw("PEsame");
  c2->Update();

  TCanvas *c3 = new TCanvas("c3", "residual", 1200, 900);
  hQtot_Bi->SetNormFactor(1);
  hQtot_Bi_d->SetNormFactor(1);
  TH1D *h1 = (TH1D*)hQtot_Bi->Clone("h1");
  h1->SetLineColor(kBlack);
  h1->SetLineWidth(2);
  h1->Sumw2();
  h1->SetStats(0);
  h1->Divide(hQtot_Bi_d);
  //h1->SetMinimum(0);
  //h1->SetMaximum(10000);
  hQtot_Bi->Chi2Test(hQtot_Bi_d, "WW P");
  h1->Draw("E0");
}
Hello Rooters.
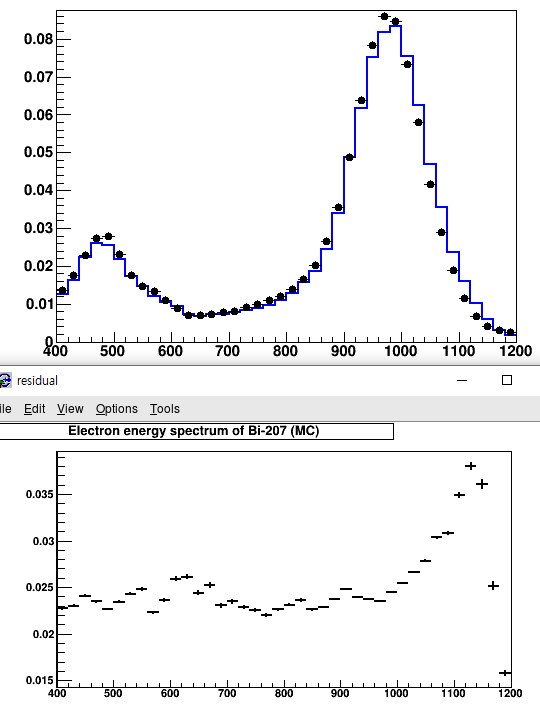
I am attempting a residual plot of the spectrum obtained through MC simulation (blue line) and experiments (black dots). The experimental result is the spectrum excluding the background. The residual plot was done as shown in the figure below and the chi2 value was obtained. The chi2 value was 10576, the NDF value was 39. I am wondering if this code and the result obtained is correct. Please add a comment.
 That said, the probability of ending up with chi2==10576 with NDF 39 is extremely small: