I’m so new using root, I want to ask about reading files with a macro in root I have a dat file like this:
1 5.3 3.4
2 1.5 2.5
3 2.5 3.5
4 7.3 9.8
5 9.4 2.6
6 9.2 6.3
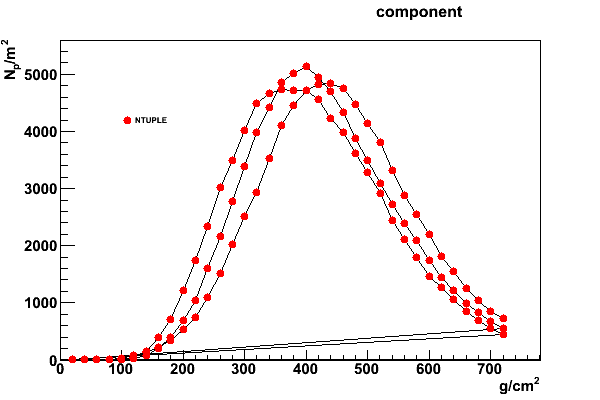
I try to graph with dots and lines but unfortunately root made lines from the last point from first block to first number of second block, I don’t want that straight lines, I only want to draw the curves and their average.
Could someone give me a hint about having just the curves and not the straigth lines and the average of data?
For more details or a better graphic explanation I add the graph, the dat file and the macro I used.
this is how the option L is working for ntuple.
you can draw the ntuple with the option “goff”"
to not draw any thing
Get the graph like explained in the doc: root.cern.ch/root/html534/TTree. … ree:Draw@1
By default the temporary histogram created is called "htemp", but only in
  the one dimensional Draw("e1") it contains the TTree's data points. For
  a two dimensional Draw, the data is filled into a TGraph which is named
  "Graph". They can be retrieved by calling
    TH1F *htemp = (TH1F*)gPad->GetPrimitive("htemp"); // 1D
    TGraph *graph = (TGraph*)gPad->GetPrimitive("Graph"); // 2D

  For a three and four dimensional Draw the TPolyMarker3D is unnamed, and
  cannot be retrieved.

  gPad always contains a TH1 derived object called "htemp" which allows to
  access the axes:
    TGraph *graph = (TGraph*)gPad->GetPrimitive("Graph"); // 2D
    TH2F   *htemp = (TH2F*)gPad->GetPrimitive("htemp"); // empty, but has axes
    TAxis  *xaxis = htemp->GetXaxis();
To be more complete, it will be a bit tricky to produce the graphs as you want using a ntuple. The method I suggested before will return you 1 graph and you will still have these connection lines.
The best would be that you use directly TGraph. Make 3 of them. You can them group them in a TMultiGraph to plot them in one go.
Thank you very much for your sooner response, in fact I think it would be simplier made three files this because it’s something I can do quickly, but your suggestion is very good, in the future I’ll try to do that way when I have more experience with root.
But it remain one question and this is how to get the average of this files with error bars, hope someone could give a hint
Best regards.
Alma
You can get the X and Y vectors from the TGraphs (see help). Then you can do all the computations you need on them (average, errors bars) and build a TGraphErrors with that.