I’m trying to put two different Graphs on the same canvas and save the plot on a pdf. Actually,
I would like to produce 36 plots like that and append them to the same pdf file. In the following
my code:
c1 = TCanvas( 'c1', 'c1', 1400, 800 )
mg = TMultiGraph("mg","mg")

for hh in range(len(pmt_list)):
	gr = TGraph(nEntries_sipm, time,  pmt_counts[hh])
	gr.SetName('PMT mean count')
	gr.SetTitle('PMT Light Curve')
	gr.SetMarkerStyle(20)
	gr.SetMarkerColor(1)
	gr1 = TGraph(nEntries_sipm, time,  mean_sipm)
	gr1.SetTitle( 'SiPM matrix mean counts' )
	gr1.SetName( 'SiPM matrix mean counts' )
	gr1.SetMarkerStyle(29)
	gr1.SetMarkerColor(2)
	mg.Add(gr)
	mg.Add(gr1)
	str_obj = str(hh)
	name = 'PMT # '+str_obj+" and SiPM mean count comparison"
	mg.SetTitle(name)
	mg.Draw()
	#mg.GetXaxis().SetTitle("time [s]")
	#mg.GetYaxis().SetTitle("counts")
	#print hh
	if(hh==0):
		c1.SaveAs(folder+"temp.pdf(")
	elif(hh!=0 and hh<len(pmt_list)):
		c1.SaveAs(folder+"temp.pdf")
        #else:
	elif(hh==len(pmt_list)):
		c1.SaveAs(folder+"temp.pdf)")
Here pmt_counts, mean_sipm and time are respectevely a numpy list containing 36 numpy array and two numpy array. The number of events is the same. So I don’t get any problem from the TGraph function. I experienced different kind of problems instead: first of all as you could see there are two commented rows because if I try to set axis name to the Multigraphs I get the following error: mg.GetXaxis().SetTitle(“time [s]”)
ReferenceError: attempt to access a null-pointer
I tried also adding gPad.Update() but I’m not using a Pad so as I expected another problem occurred because the name ‘gPad’ is not defined.
Moreover the PDF file is created and I get no errors but I cannot open it because it is damaged.
Even if i change the lasts code lines as the following:
if(hh==0):
   	c1.SaveAs(folder+"temp.pdf(")
   elif(hh!=0 and hh<35):
   	c1.SaveAs(folder+"temp.pdf")
   else:
   	c1.SaveAs(folder+"temp.pdf)")
the PDF is created but it contains 36 pages with nothing. Could you please help me to solve those two problems with explanations? Thanks in advance!
Hi Couet,
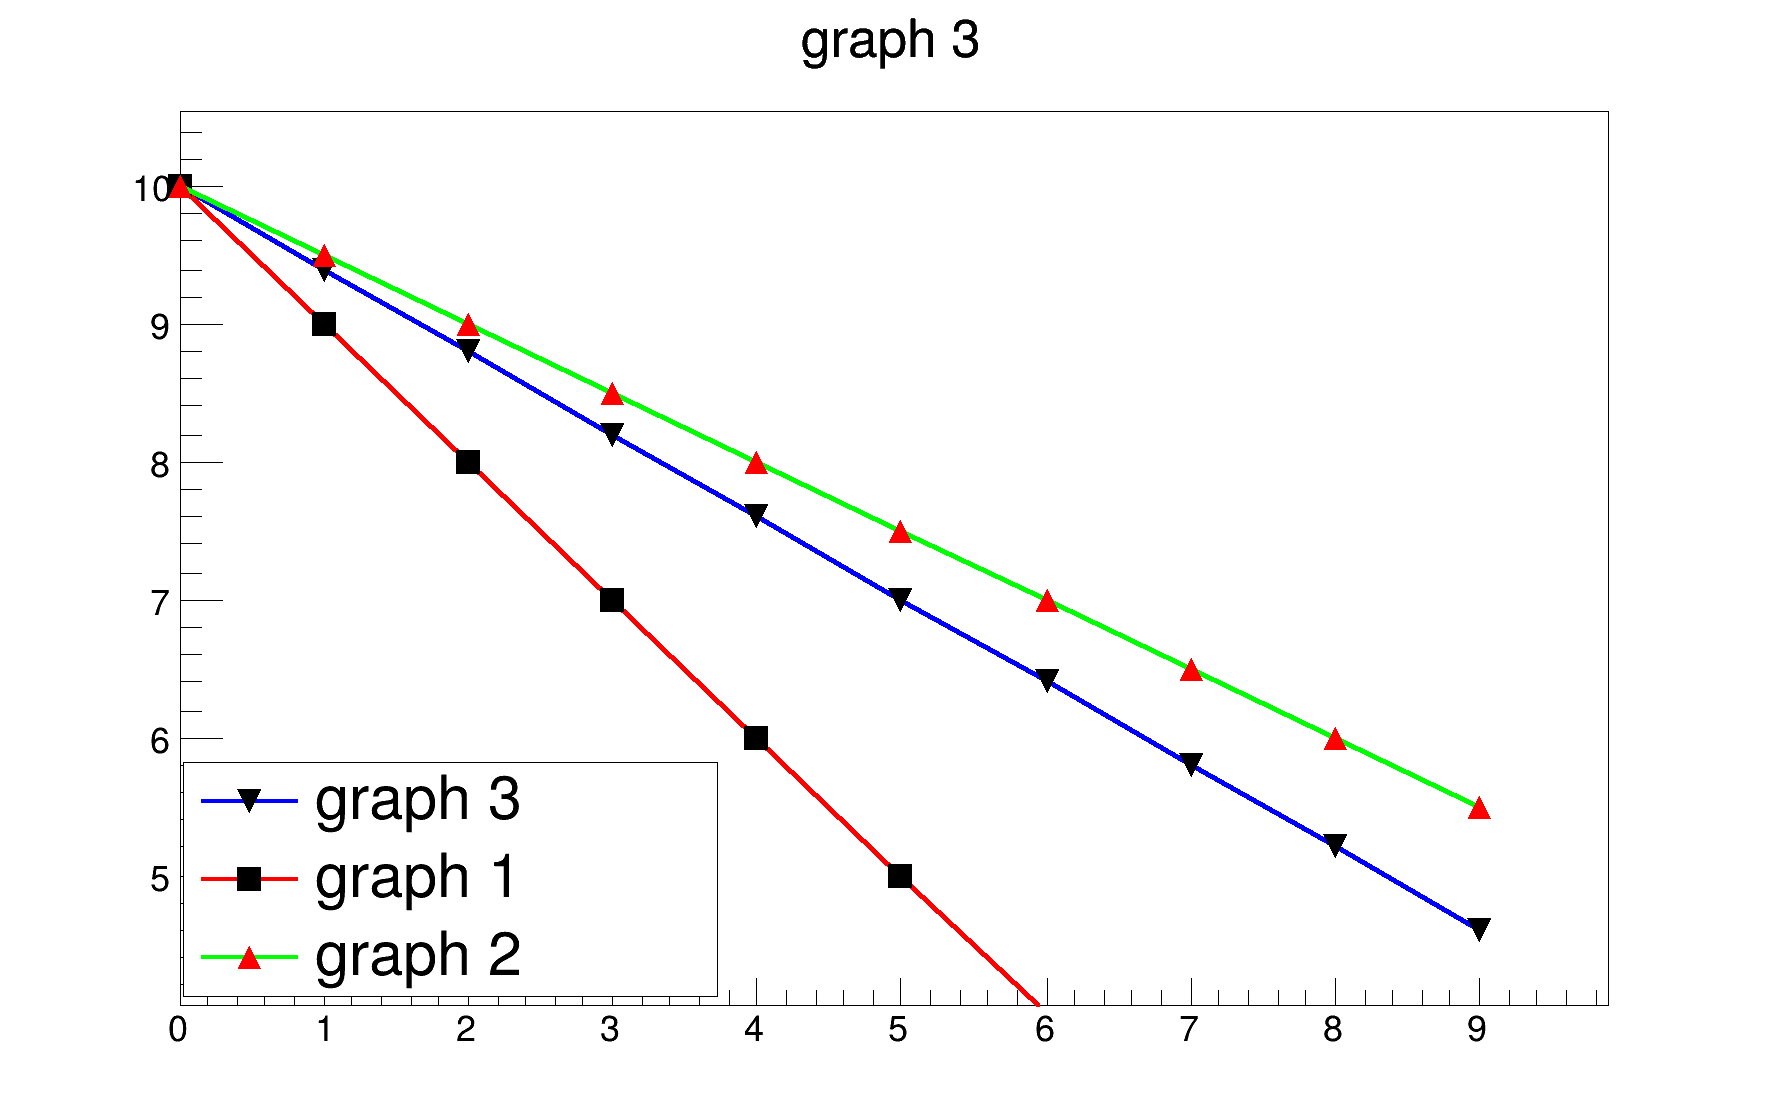
I’m not an expert about ROOT, but as i remember cd() is used to divide a canvas, which is not what I want. I want to plot two different functions in the same canvas, like that
Now, the c1.Print() or the c1.SaveAs() method should both work…maybe you’re right and I’m mistaking but from your answer I don’t even understand what is hpx. And if it is a TGraph pointer, I should need two because I have two different data.
Sorry, but I don’t get your answer.
Hello everyone,
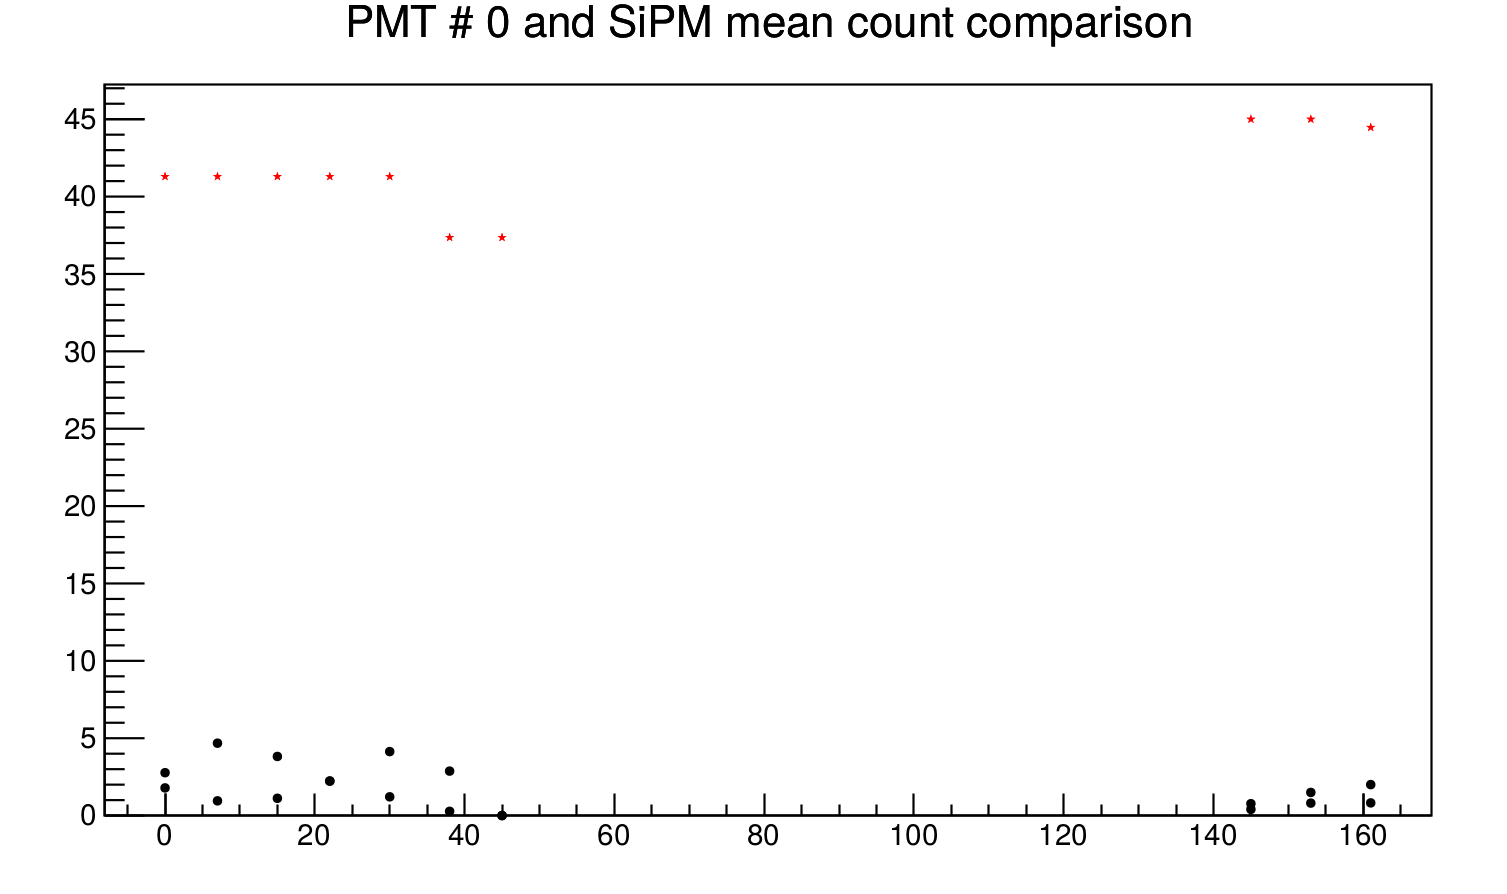
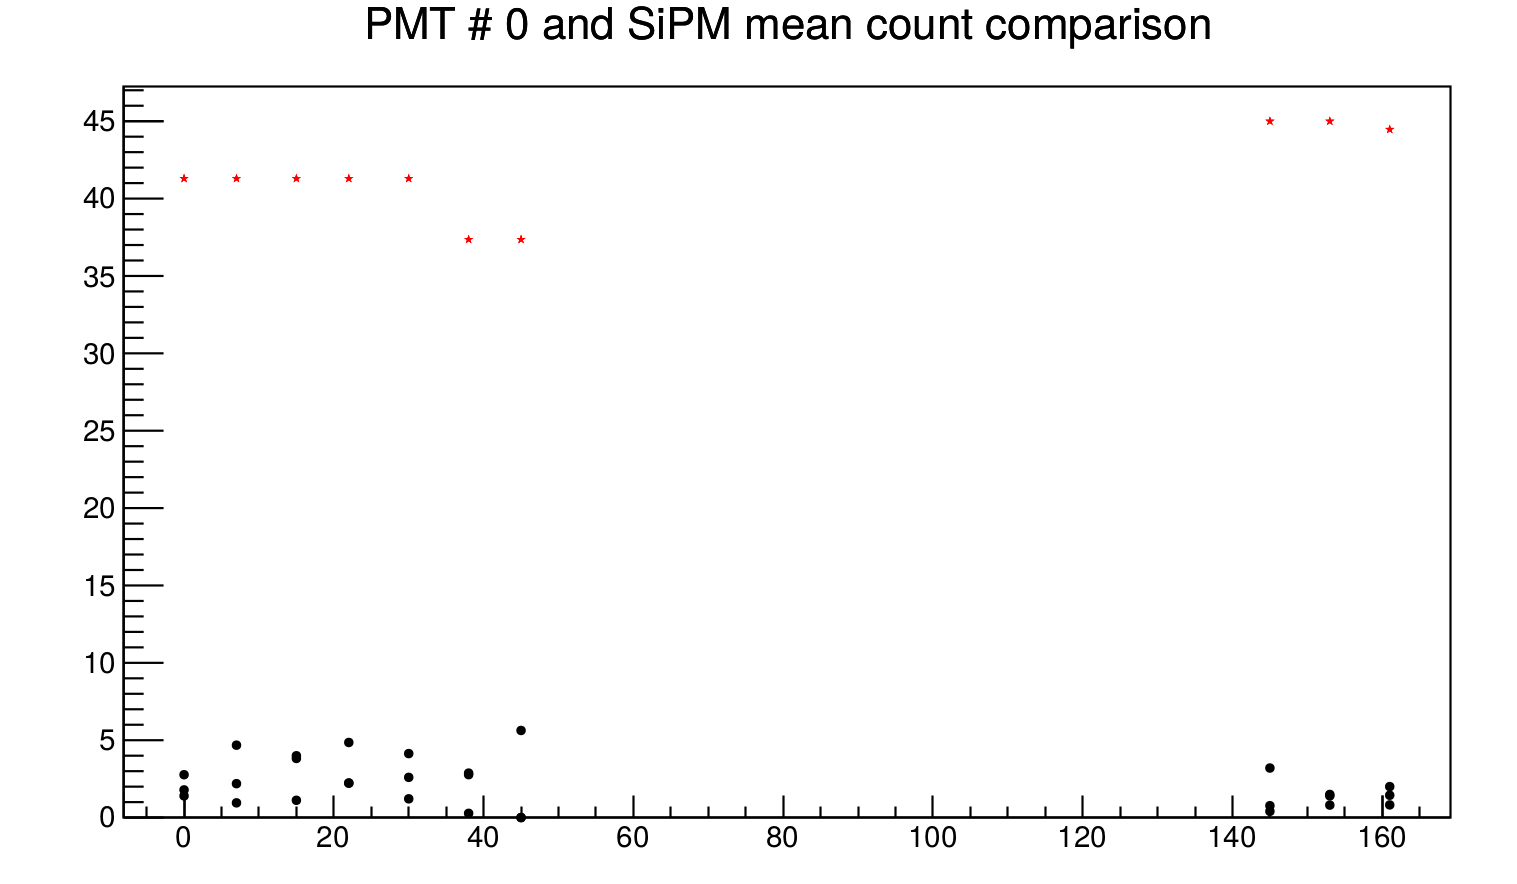
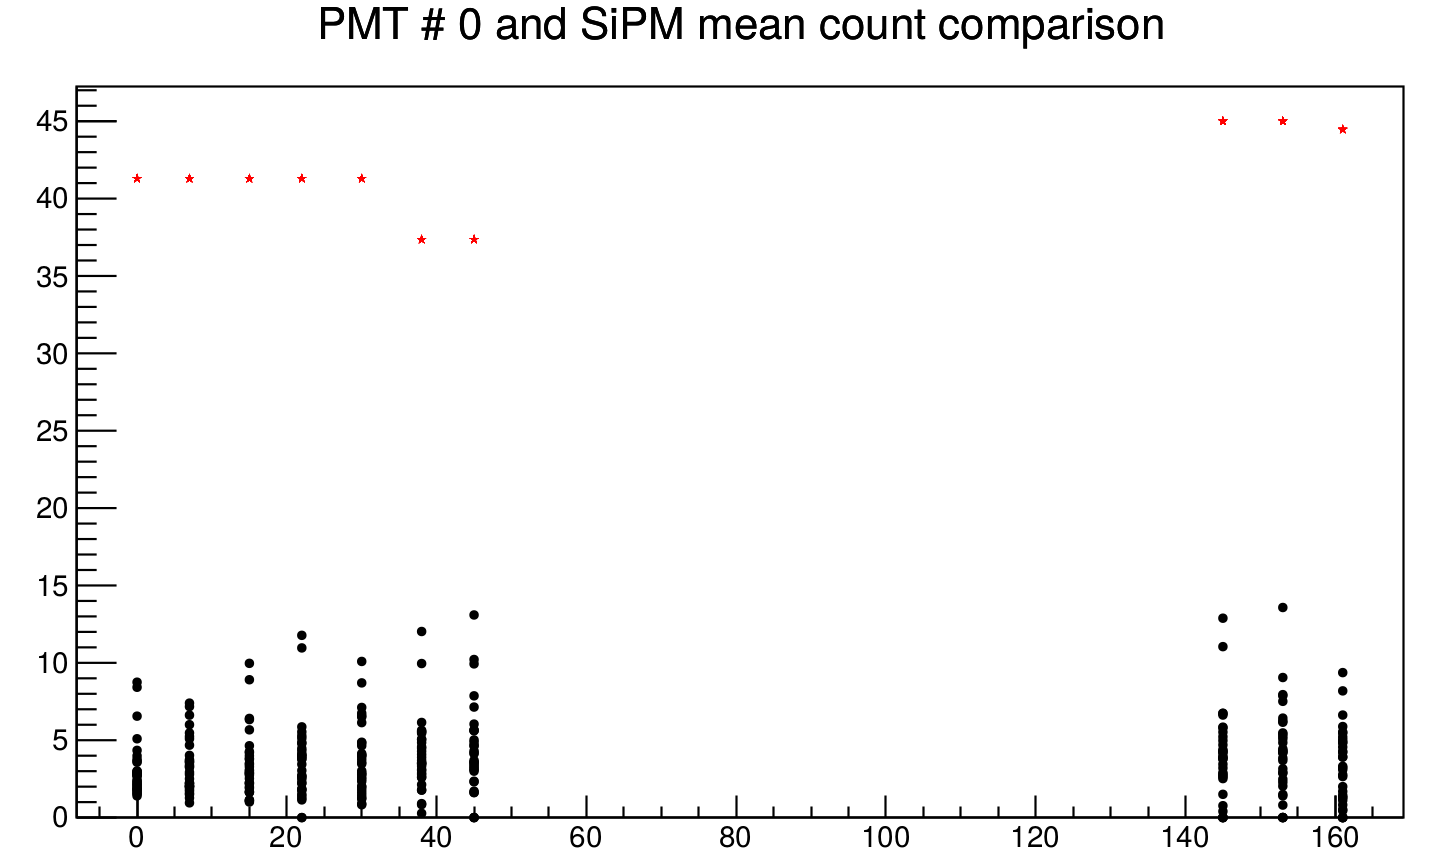
so, I need your help again! Altough right now the PDF with all plots is been created at each cycle the canvas is overwritten with the new data, so that at the end I have 36 different sets of point.
In the following an example in which are shown the first two pages and the last one of the PDF.
at the and of the loop lines but nothing changes!
Moreover the Multigraph title still remain “PMT # 0 and SiPM mean count comparison”, thus it seems like that the piece of code
 str_obj = str(hh)
 name = 'PMT # '+str_obj+" and SiPM mean count comparison"
 mg.SetTitle(name)
is not working.
Any tips on those two problem please?
You only created one TMultiGraph (mg) outside the for loop, and in every iteration you keep adding 2 graphs to the same mg. If you only want 2 graphs on each canvas try using a new multigraph for every iteration.
Thanks dastudillo,
actually i didn’t reply because I’d already solved the problem. So just for whom may be interested in it, as dastudillo suggested, at each iteraction the multigraph is been created again:
for hh in range(36):
	gr = TGraph(nEntries_sipm, time,  pmt_counts[hh])
	gr.SetName('PMT mean count')
	gr.SetTitle('PMT Light Curve')
	gr.SetMarkerStyle(20)
	gr.SetMarkerColor(1)
	gr1 = TGraph(nEntries_sipm, time,  mean_sipmone)
	gr1.SetTitle( 'SiPM matrix mean counts' )
	gr1.SetName( 'SiPM matrix mean counts' )
	gr1.SetMarkerStyle(29)
	gr1.SetMarkerColor(2)
	mg = TMultiGraph("mg","PMT and SiPM Light Curve")
	mg.Add(gr)
	mg.Add(gr1)
	str_obj = str(hh)
	name = 'PMT # '+str_obj+" and SiPM mean count comparison"
	mg.SetTitle(name)
	mg.Draw("AP")
        #c1.BuildLegend()
	c1.SaveAs(folder+"temp.pdf")