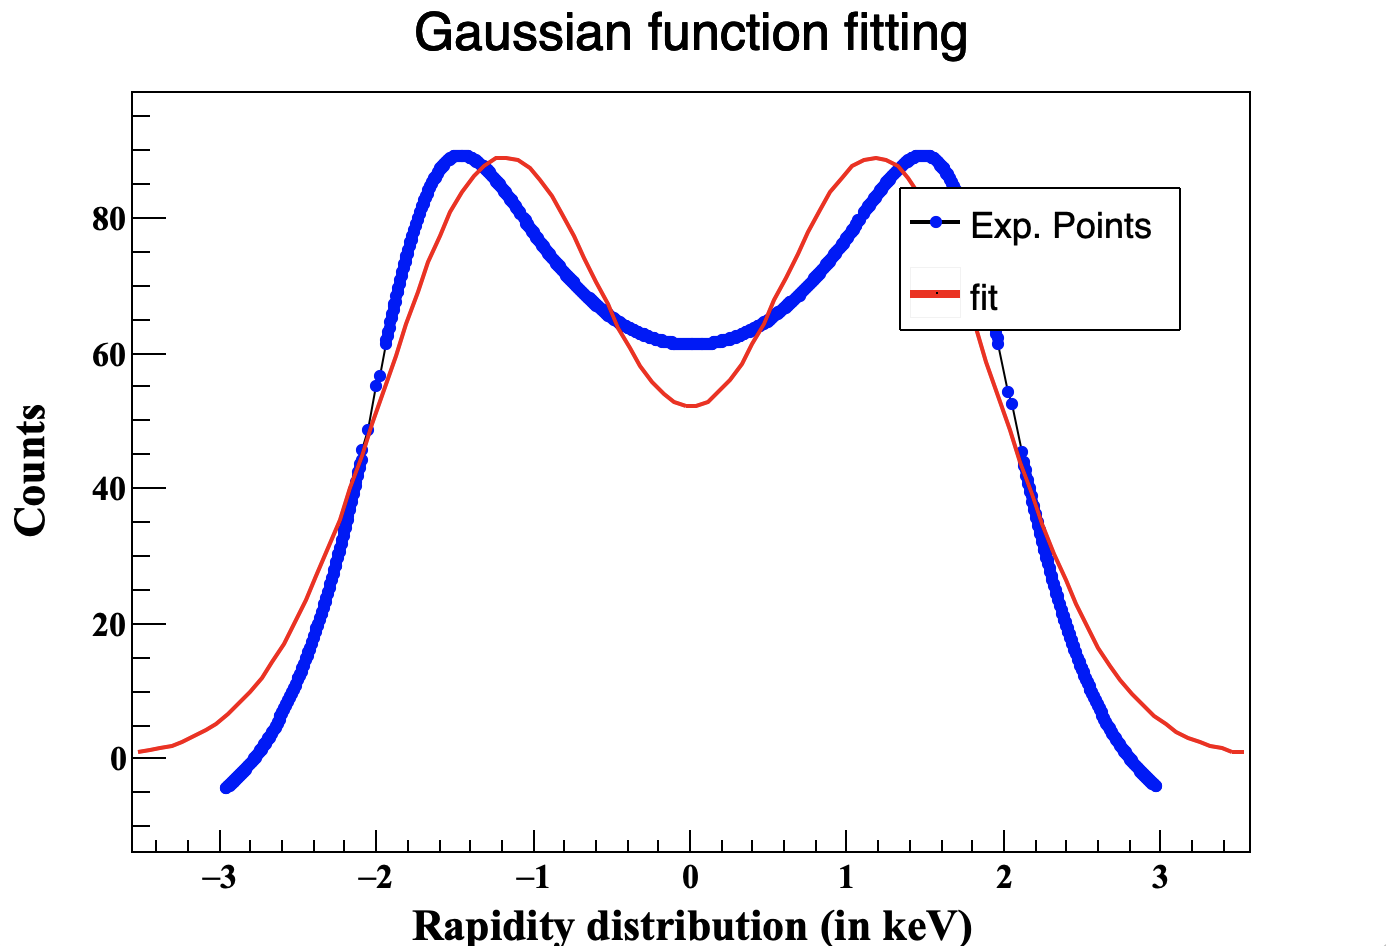
I was trying to fit the camel function using root. Please see the attached plot. I am making a,b,c as variables but still, I am not able to fit it properly. Please see the attached root program and suggest if I can improve this program or not ?
void plot_fit()
{
TGraph *gr = new TGraph("Book1.txt","%lg %lg");
gr->SetTitle("Gaussian function fitting");
gStyle->SetTitleFontSize(0.06);

gr->GetXaxis()->SetTitle("Rapidity distribution (in keV)");
gr->GetXaxis()->CenterTitle(true);
gr->GetXaxis()->SetLabelSize(0.04);
gr->GetXaxis()->SetLabelFont(22);
gr->GetXaxis()->SetTitleSize(0.05);
gr->GetXaxis()->SetTitleFont(22);

gr->GetYaxis()->SetTitle("Counts");
gr->GetYaxis()->CenterTitle(true);
gr->GetYaxis()->SetLabelSize(0.04);
gr->GetYaxis()->SetLabelFont(22);
gr->GetYaxis()->SetTitleSize(0.05);
gr->GetYaxis()->SetTitleFont(22);

//Marker Styles
gr->SetMarkerStyle(kFullDotLarge);
gr->SetMarkerSize(0.7);
gr->SetMarkerColor(kBlue);

//Line Styles
gr->SetLineWidth(2);
gr->SetLineColor(kBlack);

//In-built root function
TF1 *f = new TF1 ("custom_fit","[0]*exp(-[1]*x*x)*cosh([2]*x)",-5,5);

f->SetParameter(0, 0.34);
f->SetParameter(1, 0.78);
f->SetParameter(2, 1.76);


// Perform the fit
gr->Fit("custom_fit", "R");

// Access and print the fit results
double A = f->GetParameter(0);
double B = f->GetParameter(1);
double C = f->GetParameter(2);

// Print the parameter values to the console
cout << "Fit Results:" << endl;
cout << "A: " << A << endl;
cout << "B: " << B << endl;
cout << "C: " << C << endl;


// Perform the fit
//graph->Fit("custom_fit", "R");

// Access and print the fit results
double fitted_A = f->GetParameter(0);
double fitted_B = f->GetParameter(1);
double fitted_C = f->GetParameter(2);

// Access the fitting equation from the fit function's title
const char* fitting_equation = f->GetTitle();

// Extract the equation portion of the title
std::string equationStr(fitting_equation);

// Find the position of the colon character in the equation string
size_t colonPos = equationStr.find(':');

// Check if the colon character was found
if (colonPos != std::string::npos) {
    // Extract and print only the equation part
    std::string equation = equationStr.substr(0, colonPos);
    cout << "f=[A]*exp(-[B]*x*x)*cosh([C]*x): " << equation << endl;
} else {
    // If colon character is not found, print the entire title
    cout << "f=[A]*exp(-[B]*x*x)*cosh([C]*x): " << fitting_equation << endl;
}

// Print the parameter values
cout << "A: " << fitted_A << endl;
cout << "B: " << fitted_B << endl;
cout << "C: " << fitted_C << endl;


TCanvas *c1 = new TCanvas("c1", "Fit Canvas");

#include "TGraph.h"
#include "TF1.h"


//graph->Draw("AP"); // "AP" option for data points with error bars
f->Draw("same");
c1->Update();


//User defined function

f->SetParameters(10,0.5);
f->SetLineColor(kRed);
f->SetLineStyle(1);
f->SetLineWidth(4);


//Fitting Graph with function
gr->Fit("f");
gr->Draw("AP");


//Legends
TLegend *leg = new TLegend(.65,.65,.85,.80);
leg->SetBorderSize(1);
//leg->SetFillColor(kGreen);
leg->AddEntry(gr,"Exp. Points");
leg->AddEntry(f,"fit");
leg->Draw("same");

//Printing parameters values (Not required for in-built functions)
//double *par = f->GetParameters();
//cout<<"p0="<<par[0]<<"\t"<<"p1="<<par[1]<<"\n";
}
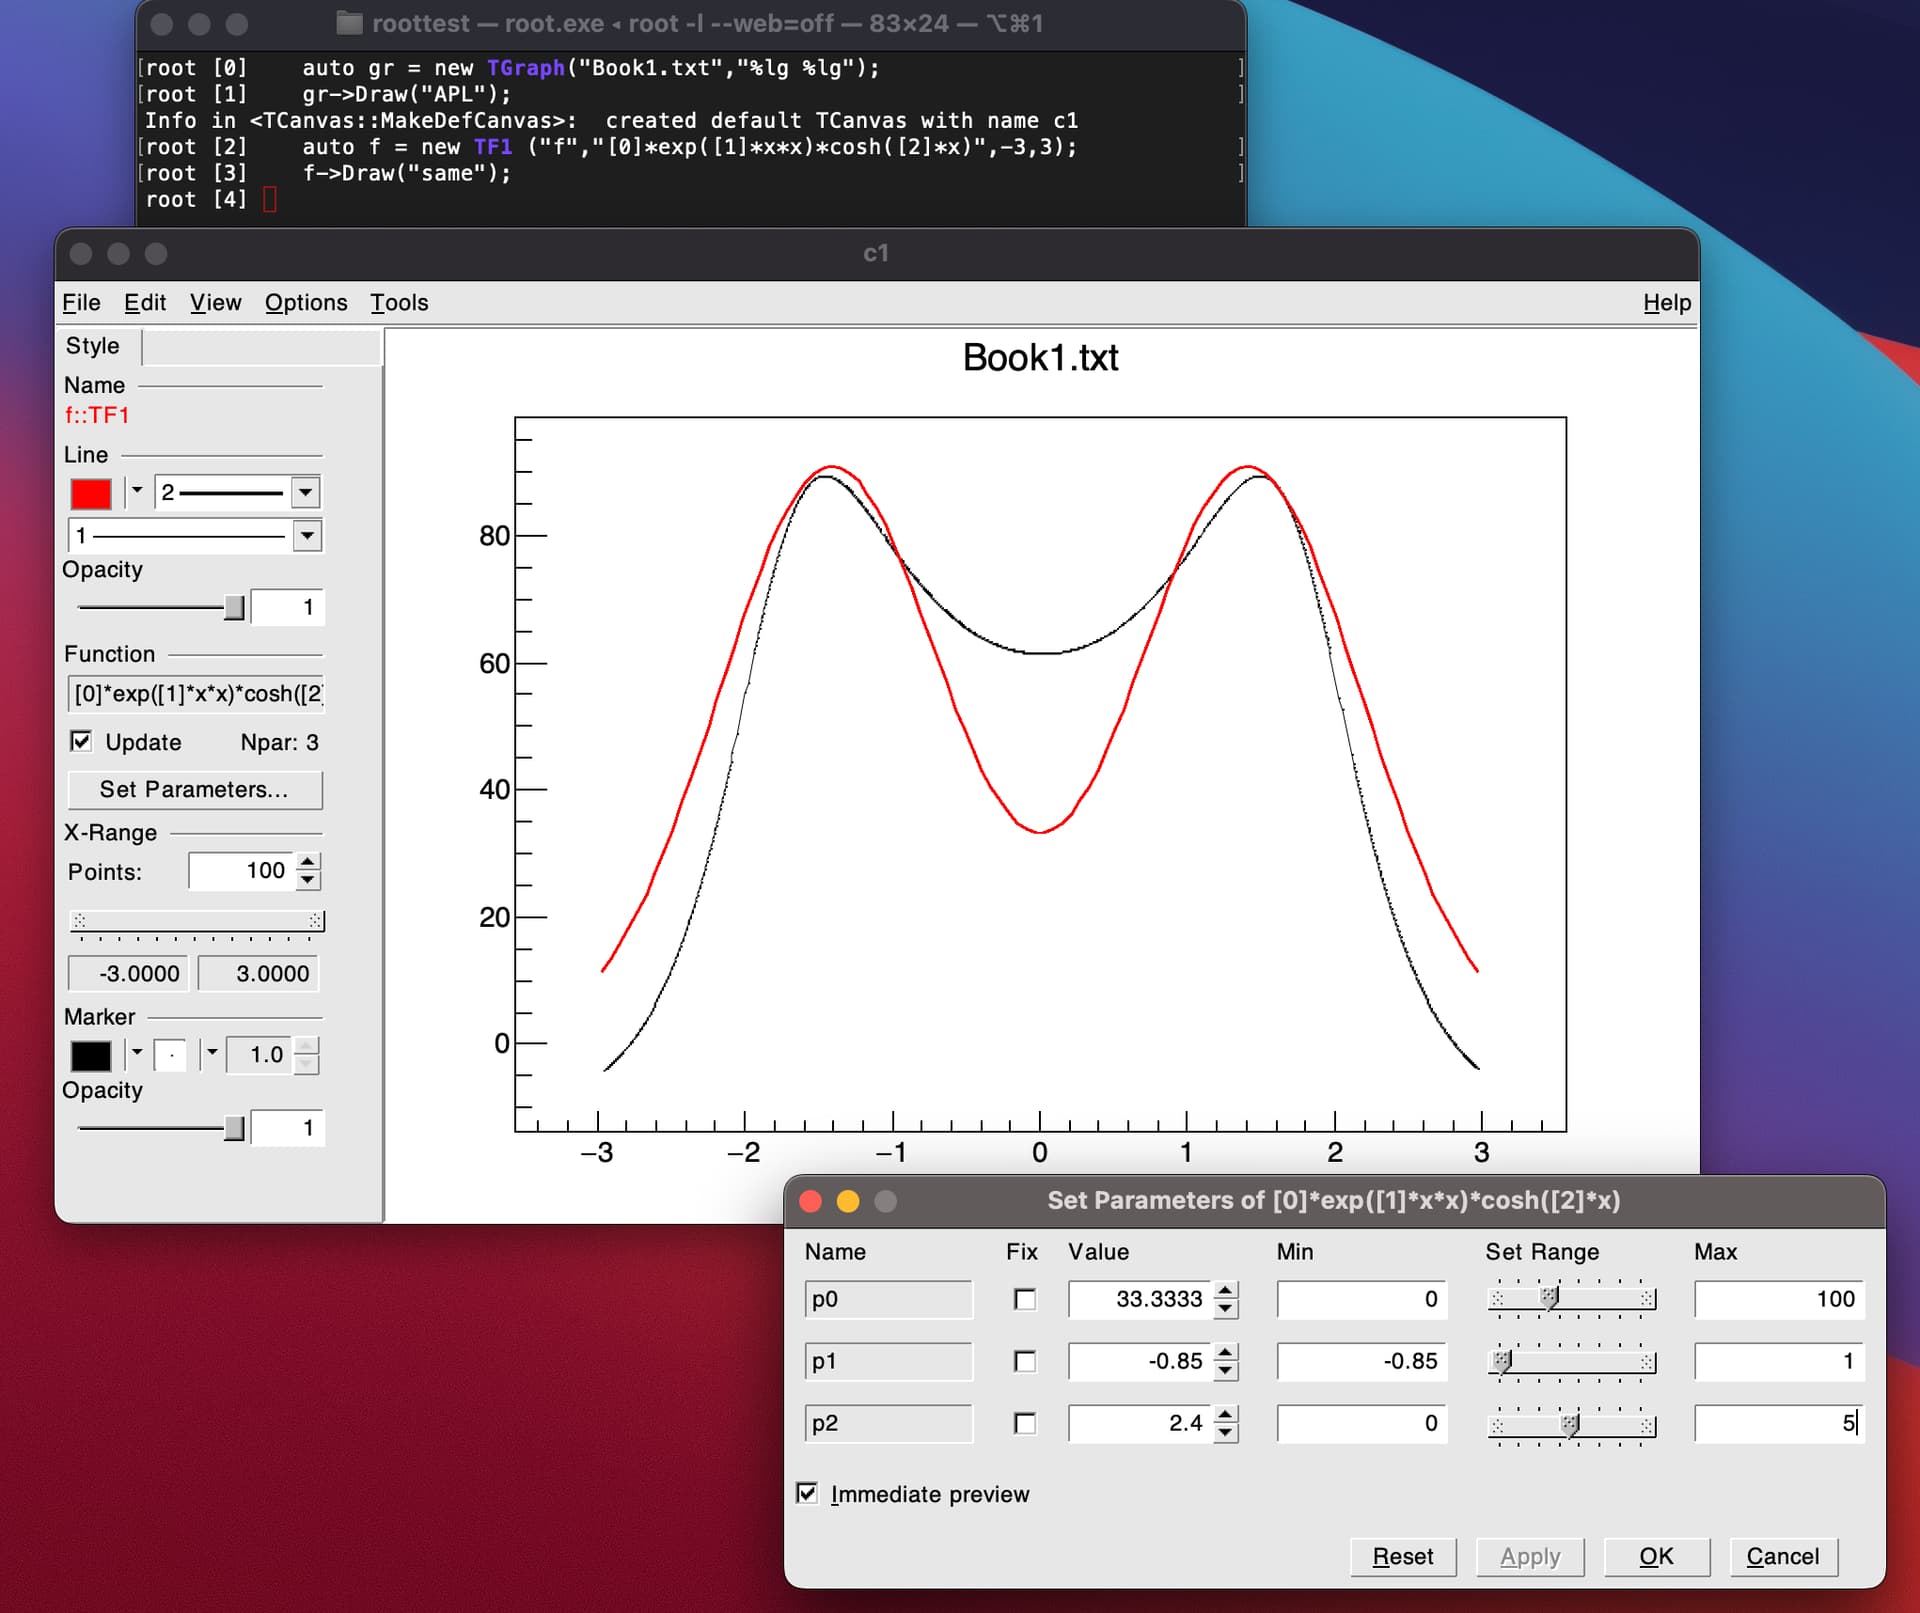
void plot_fit()
{
   auto gr = new TGraph("Book1.txt","%lg %lg");
   gr->SetTitle("Gaussian function fitting");

   gStyle->SetTitleFontSize(0.06);

   gr->GetXaxis()->SetTitle("Rapidity distribution (in keV)");
   gr->GetXaxis()->CenterTitle(true);
   gr->GetXaxis()->SetLabelSize(0.04);
   gr->GetXaxis()->SetLabelFont(22);
   gr->GetXaxis()->SetTitleSize(0.05);
   gr->GetXaxis()->SetTitleFont(22);

   gr->GetYaxis()->SetTitle("Counts");
   gr->GetYaxis()->CenterTitle(true);
   gr->GetYaxis()->SetLabelSize(0.04);
   gr->GetYaxis()->SetLabelFont(22);
   gr->GetYaxis()->SetTitleSize(0.05);
   gr->GetYaxis()->SetTitleFont(22);

   //Marker Styles
   gr->SetMarkerStyle(kFullDotLarge);
   gr->SetMarkerSize(0.7);
   gr->SetMarkerColor(kBlue);

   //Line Styles
   gr->SetLineWidth(2);
   gr->SetLineColor(kBlack);

   //In-built root function
   auto f = new TF1 ("f","[0]*exp(-[1]*x*x)*cosh([2]*x)",-3,3);
   f->SetLineColor(kRed);
   f->SetLineStyle(1);
   f->SetLineWidth(4);
   f->SetParameter(0, 50.);
   f->SetParameter(1, 1.);
   f->SetParameter(2, 2.);

   // Perform the fit
   gr->Fit("f");

   // Draw the fit and data
   gr->Draw("APL");

   //Draw the legend
   TLegend *leg = new TLegend(.65,.65,.85,.80);
   leg->SetBorderSize(1);
   leg->AddEntry(gr,"Exp. Points");
   leg->AddEntry(f,"fit");
   leg->Draw();
}
I am not sure which function is the best or if , by adjusting the initial values of the parameter, this function can do better. Let’s ask @moneta, he will know better.
I think we can argue here on what is the best function which can reproduce the trend you measured, however the person who is best placed to do so is you.
You know your experimental setup, you know the phenomenon you are measuring and know the model/theory that describes it best: I am sure you can identify the best fucntion - any suggestion we may make risks to be unphysical and spoil the meaning of the physics you are studying!
Thanks for Physics reply, yes its a bit difficult to justify in physics slight deviation from camel function…But I shall try to hunt for it. Still Can’t we force the Camel function to fit the graph more better by increasing accuracy or modifying the algorithm of fit?
what I propose is to check by eye if you can find the right combination of parameters values that reproduce your trend. That will tell you if the functional form is the right one. Right?
I hope this helps.
Do not expect too much of it. I tried a bit and I must admit it was not easy to get an exact match. In other words, the ROOT fitter does a good job already.