I’m running into a problem due to the way the TRatioPlot constructor is defined. I want to define a TRatioPlot in the following way:
ratio = ROOT.TRatioPlot(data,MC)
where data is a TH1 and MC is a TStack
However, the constructor of TRatioPlot only accepts TStack as the first argument, so I can only draw the ratio plot of a TStack/TH1, not the other way around. I found a couple old threads about this exact issue [1,2], but it is unclear to me how to implement the solution in PyRoot.
This is the relevant code in the TRatioPlot constructor for THStack and TH1:
   TList *stackHists = st->GetHists();

   if (stackHists->GetSize() == 0) {
      Warning("TRatioPlot", "Stack does not have histograms");
      return;
   }

   auto tmpHist = static_cast<TH1 *>(stackHists->At(0)->Clone());
   tmpHist->Reset();

   for (int i = 0; i < stackHists->GetSize(); ++i) {
      tmpHist->Add(static_cast<TH1 *>(stackHists->At(i)));
   }
You can do
import sys
import ROOT as R
hs = R.THStack("hs","")
h1 = R.TH1F("h1","test hstack",10,-4,4)
h1.FillRandom("gaus",20000)
h1.SetFillColor(2)
hs.Add(h1)
h2 = R.TH1F("h2","test hstack",10,-4,4)
h2.FillRandom("gaus",15000)
h2.SetFillColor(3)
hs.Add(h2)
h3 = R.TH1F("h3","test hstack",10,-4,4)
h3.FillRandom("gaus",10000)
h3.SetFillColor(4)
hs.Add(h3)
cs = R.TCanvas("cs","cs",10,10,900,600)
cs.Divide(2,1)
T = R.TText()
T.SetTextFont(42)
T.SetTextAlign(21)
cs.cd(1)
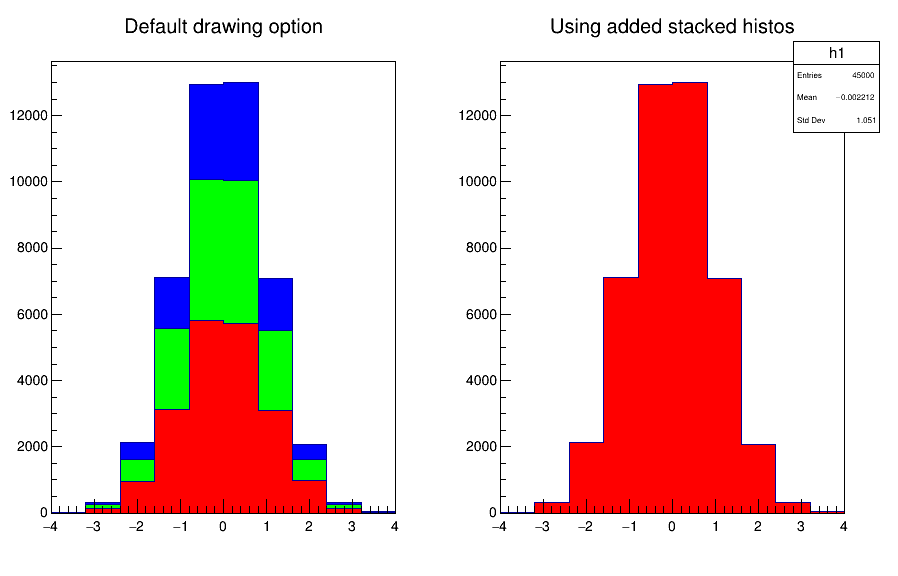
hs.Draw()
T.DrawTextNDC(.5,.95,"Default drawing option")
cs.cd(2)
nhist = hs.GetHists().GetSize()
print("Number of histos in THStack:",nhist)
if nhist == 0:
sys.exit()
tmpHist = hs.GetHists().At(0).Clone()
tmpHist.Reset()
tmpHist.SetTitle("")
for i in range(hs.GetHists().GetSize()):
tmpHist.Add(hs.GetHists().At(i))
tmpHist.Draw()
T.DrawTextNDC(.5,.95,"Using added stacked histos")