PyROOT & C++: Fill TCanvas.cd(n) with a for loop

Hi
I’m trying to divide a TCanvas in four pads, and then plot different things in them, the relevant code is:

def main():
    paths = ["run_01_files/run_01.root", "run_02_files/run_02.root", "run_03_files/run_03.root", "run_04_files/run_04.root"]
    
    dependent_variables = []
    independent_variables = []
    keys = []
    for i in range(len(paths)):
        aux = create_dicts(paths[i])
        independent_variables.append(aux[0])
        dependent_variables.append(aux[1])
    keys = aux[0].keys()

    nominal = "SM"
    for i in range(len(keys)):
        key = keys[i]
        if key == nominal: continue
        c1 = ROOT.TCanvas(key, key)
        c1.Divide(4, 1)
        
        for z in range(4):
            print(z) 
            c1.cd(z+1)
            independent_variable = independent_variables[z][key]
            dependent_variable = dependent_variables[z][key]
        
            gr1 = ROOT.TGraphErrors()
            for j in range(len(independent_variable)):
                gr1.SetPoint(j, independent_variable[j], dependent_variable[j])
                gr1.SetPointError(j, 0.00001, 0.05)
        
            gr1.SetMarkerStyle(ROOT.kFullCircle)
        
            gr1.GetXaxis().SetTitle(key)
            gr1.GetYaxis().SetTitle(r"\sigma/\sigma_{SM}")        

            gr1.Draw("ap")
            #c1.Update()

        c1.Print("output/" + key + ".pdf")

After that, the canvas are like this:
cHQ1.pdf (13.3 KB)

If I uncomment the c1.Update():
cHQ1.pdf (13.4 KB)


Please read tips for efficient and successful posting and posting code

ROOT Version: 6.20.06
Platform: x86_64-centos7-gcc8-opt
Compiler: Not Provided


z start from 0 ?
It looks like in you inner loop to always redefine gr1.
The Pseudo code would be:

c1 = TCanvas()
c1.Divide(4, 1)

for i=1 to 4
   Create graph `gr-i`
   Fill graph `gr-i`
   c1.cd(i)
   Draw graph `gr-i`

Thanks for your reply @couet !

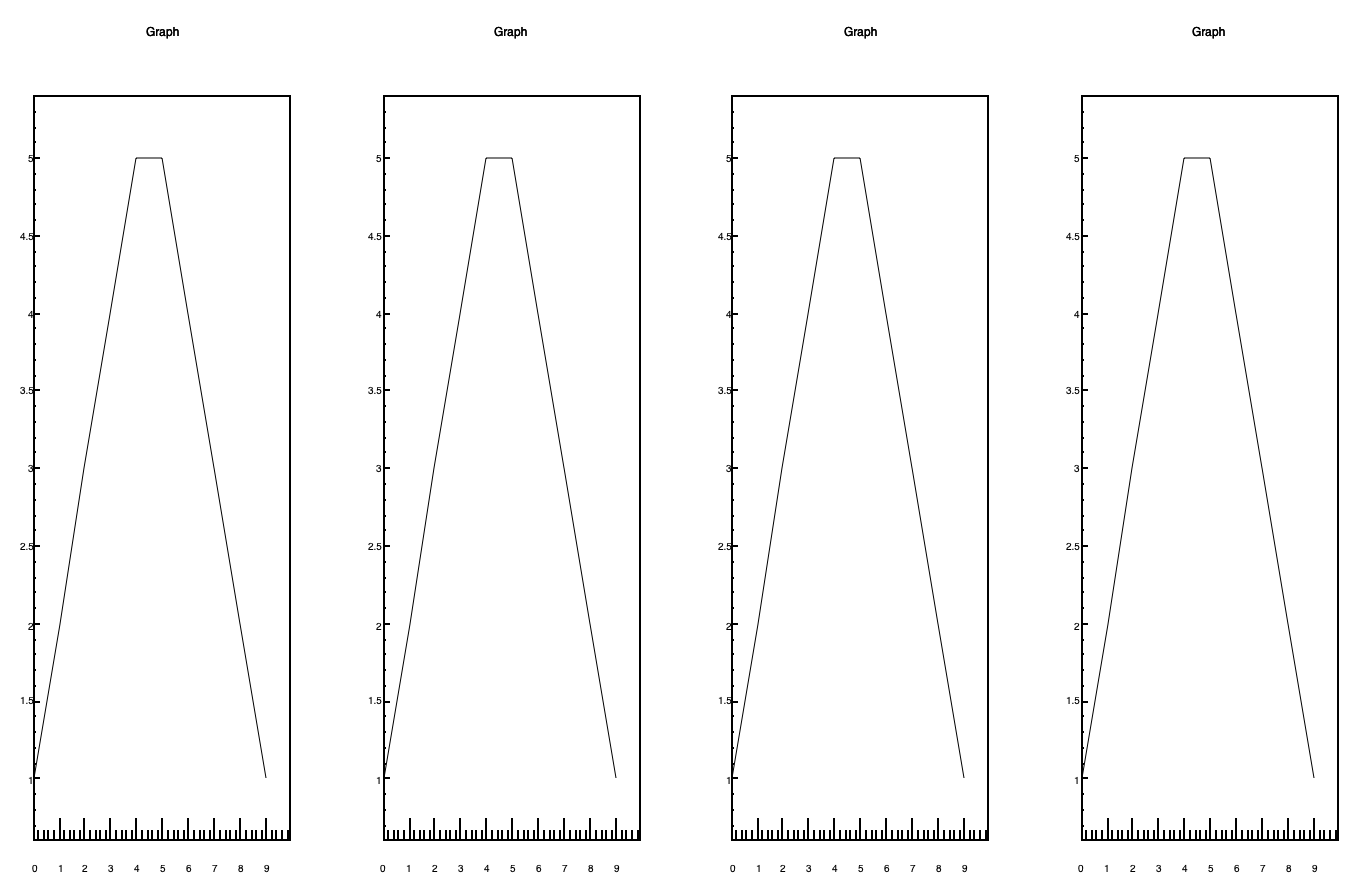
It’s a bit tricky. independent_variables (and dependent_variables) contains four dictionaries, one for each cut of invariant mass of a l+l- system. This dictionaries contain the cross-section for different Wilson coefficients for a given invariant mass. So for a given dict, when I do dict[key] I get all the values of the cross-section as one Wilson coefficient varies for a given invariant mass cut. The idea is to represent this cross-sections variations for each invariant mass cut, putting one graph next to the other.

So, for a given key (a given Wilson coefficient), the z runs over the number of cuts in invariant mass, it goes from 0 to 3 and I extract the values of the cross-sections. Because of the TCanvas.cd starts at 1, I need z+1 to get the right pad.

If I put the c1.cd(z+1) where you say, nothing changes.

Ok, lets simulate what you are doing with some real code in that case:

void acgc99() {
   TGraph *g[4];
   Double_t x[10] = {0,1,2,3,4,5,6,7,8,9};
   Double_t y[10] = {1,2,3,4,5,5,4,3,2,1};

   auto C = new TCanvas();
   C->Divide(4,1);

   for (int i=0; i<4; i++) {
      g[i] = new TGraph(10, x, y);
      C->cd(i+1);
      g[i]->Draw("AL");
   }
}

If I do

    for i in range(len(keys)):
        key = keys[i]
        if key == nominal: continue
        c1 = ROOT.TCanvas(key, key)
        c1.Divide(4, 1)

        graphs = {}
        
        for z in range(4):
            c1.cd(z+1)
            independent_variable = independent_variables[z][key]
            dependent_variable = dependent_variables[z][key]

            graphkey = key + str(z)
            graphs[graphkey] = ROOT.TGraphErrors()
            
            for j in range(len(independent_variable)):
                graphs[graphkey].SetPoint(j, independent_variable[j], dependent_variable[j])
                graphs[graphkey].SetPointError(j, 0.00001, 0.05)
        
            graphs[graphkey].Fit("pol2", "S")
            graphs[graphkey].SetMarkerStyle(ROOT.kFullCircle)
        
            graphs[graphkey].GetXaxis().SetTitle(key)
            graphs[graphkey].GetYaxis().SetTitle(r"\sigma/\sigma_{SM}")        

            graphs[graphkey].Draw("ap")
            c1.Update()

It works. It seems that the problem is due to how the variable gr1 was assigned. Any other solution instead of storing all graphs in a dict?

See my example …

I mean without the necessity of storing all the graph in an array (your solution) or in a dict (my solution). I think that this would be inefficient if we work with many many graphs and more complicated.

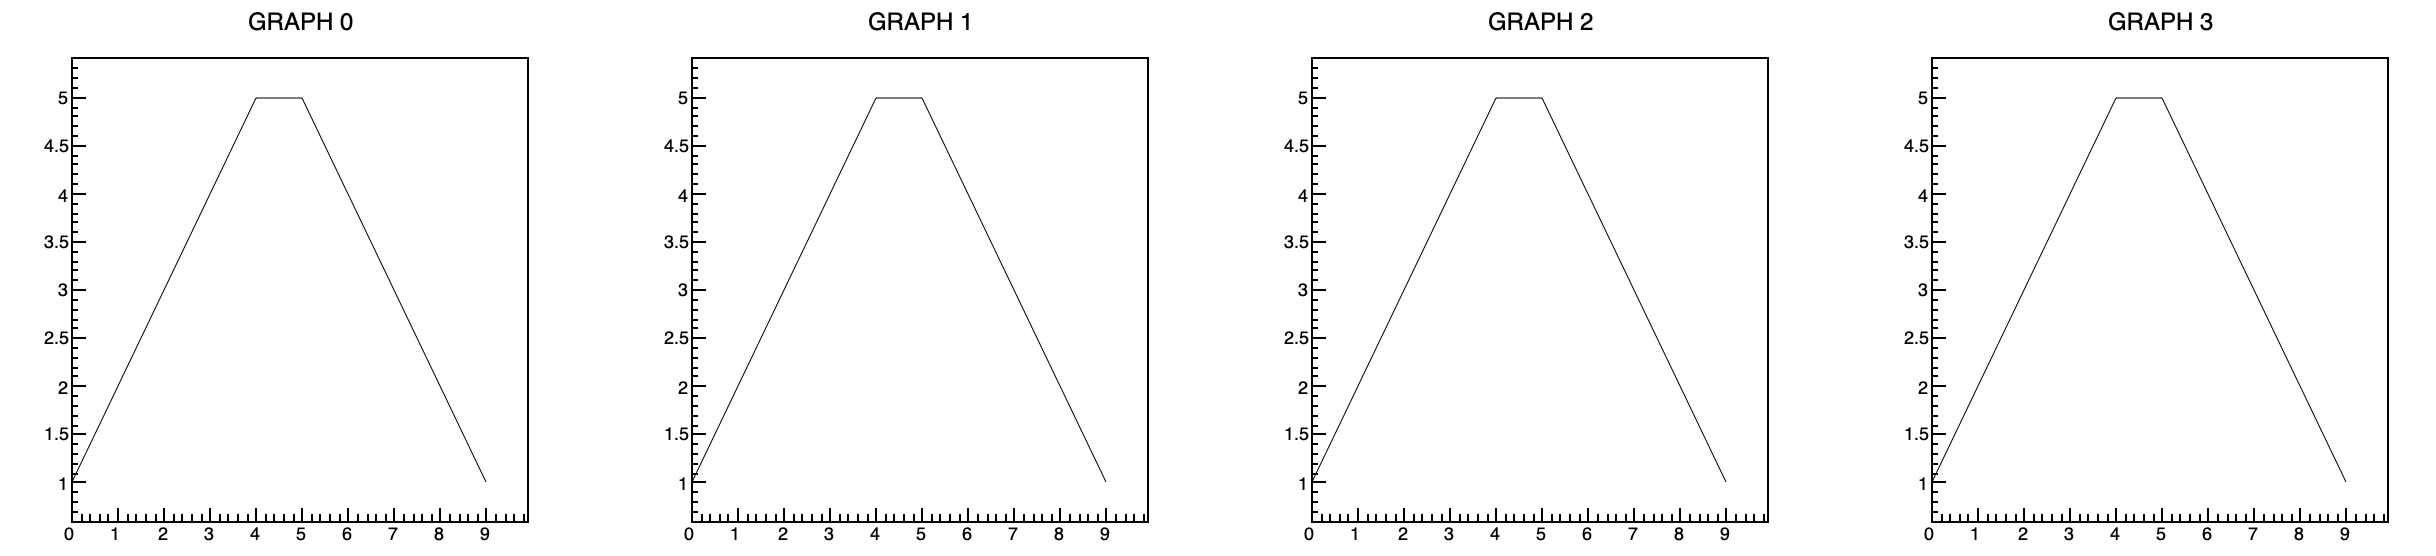
In C++ you can also avoid using an array of TGraph. The pointer to the graphs 0, 1 and 3 are lost at the end of the loop. But the graphs still exist in memory and are properly drawn. The memory comsomption is the same:

void acgc99() {
   TGraph *g;
   Double_t x[10] = {0,1,2,3,4,5,6,7,8,9};
   Double_t y[10] = {1,2,3,4,5,5,4,3,2,1};

   auto C = new TCanvas();
   C->Divide(4,1);

   for (int i=0; i<4; i++) {
      g = new TGraph(10, x, y);
      g->SetTitle(Form("GRAPH %d",i));
      C->cd(i+1);
      g->Draw("AL");
   }
}

It is not the graphs which were stored in memory in my previous example. It was the pointers to the graphs … so, nothing … The graphs are in memory in both example. That’s what uses memory.